Short
Short
EURCAD → A set of bearish patterns foreshadowing the decline FOREXCOM:EURCAD is forming a standard bearish setup on the background of the forming downtrend, as the Canadian is getting stronger than the Euro and thus changing the market direction.
On D1 we can see that in general the currency pair is in a global range and it is impossible to identify any key trend, so it is acceptable to trade both buying and selling within the range. But since we have a set of sell signals forming, we should expect further price decline.
The level of 1.46400 (D1) plays an important role. Consolidation is formed, then the level is broken, after which a pin-bar is formed on the background of the retest, which confirms the interests of the market.
On H1, the price breaks the consolidation support, makes a false break of 1.464 as part of the correction and even on H1 a bearish candlestick pattern is formed with subsequent consolidation of the price below the level, which is an additional confirmation.
Support levels: 1.458, 1.456, 1.4478, 1.4350
Resistance levels: 1.464, 1.4747
I expect a continuation of the decline, a retest of 1.464 is possible, but in general the setup hints at the continuation of the downtrend.
Regards R. Linda! GOLD → Strong dollar influences further decline in gold OANDA:XAUUSD , following my expectation, on the background of Friday's NFP falls and reaches the target. The price is testing the level of 2000, but in my opinion, this target will not end this week.
From December 11 to December 15 we are expecting a rather active week, fundamentally. On Friday we got a rather strong NPF for the dollar, which made gold fall from the zone I mentioned. The fundamental potential is not over, it will continue to influence the pricing in the medium term. It is also worth paying attention to the dollar. On the weekly timeframe we see the formation of a pinbar and a bullish candlestick, which overlaps the last two, which is a strong enough sign of further strengthening. Accordingly, gold and the forex market may react accordingly.
Gold is currently testing the support area of the bearish channel. The important zone for us is 2007 - 2009. It is possible to form a retest, an impulse to 2010-2015 , or a false breakdown. Further consolidation of the price below this level will form a bearish potential, which will continue to pressure the price. The market is directed to the mentioned zones of interest and liquidity ( 1990, 1984, 1965, 1955 ) in the medium term.
Fundamentally, the market has stopped paying attention to the nuances in the Middle East or Eastern Europe. Now everyone is waiting for some new information from Powell related to monetary policy, namely interest rates. But, more data on Initial Jobless Claims and NFP may make the Fed chief hesitant.
Also, on the weekly timeframe, I found the " Cup with handle " pattern forming interesting. It is clear that within such a period it is impossible to determine the exact place of the breakout or the point of safe entry into the market, but the tendency to the fact that the extreme phase of the expected pattern is forming is already pleasing. Most likely, in the medium and long term, the price will continue to test the resistance 2070-2100 for a breakout and the formation of a new range, but not in the near future.
OANDA:XAUUSD COMEX:GC1! COMEX_MINI:MGC1! CAPITALCOM:US500 TVC:DXY
Regards R. Linda! Short 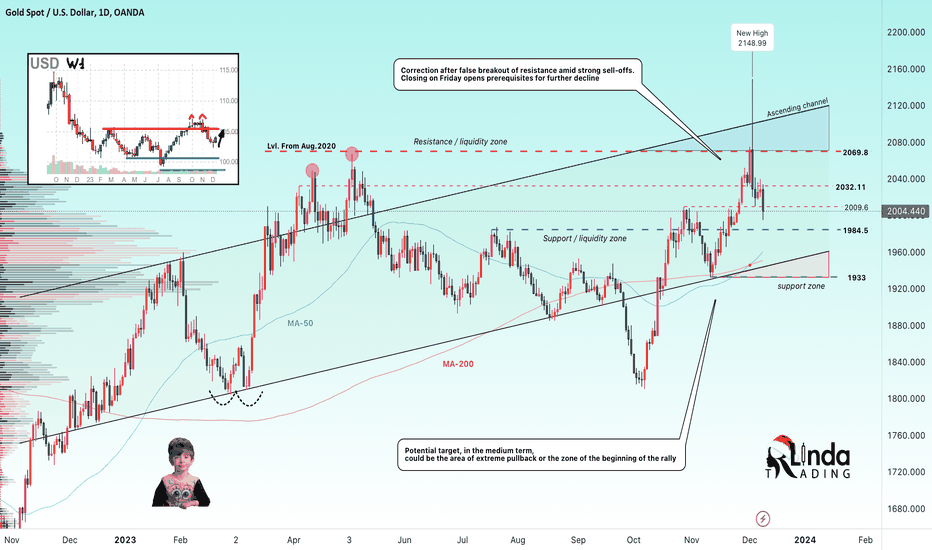
EURUSD → Correction before the news. What could happen?FX:EURUSD is forming a false breakout. This may be the reason for the formation of correction in the short term. The market is also expecting news today, which is worth paying attention to.
We are interested in CDGO (MoM) today and the one that may affect the price in the short to medium term is Initial Jobless Claims. For the latter, analysts are expecting an improvement in the indications from 231K to 225K. If the actual data released at 13:30 GMT is higher than expected, the correction may end and the pair will start to strengthen. If the data will be lower than expected, the correction is likely to be a little bit delayed
From the technical analysis point of view, an actual false breakdown could be the reason for the price decline to 1.0875 or to 0.382 or 0.5 fibo. But since we have a fairly strong fundamental basis for the medium term, the currency pair has the following areas as targets: 1.1033, 1.115, 1.127
Support levels: 1.0875, 0.382 fibo, 0.05 fibo
Resistance levels: 1.0918
The correction may continue until the publication of news that may determine the short-medium term outlook. I expect growth after the test of local support areas.
Regards R. Linda!  Short
Short
 Long
Long
Long 
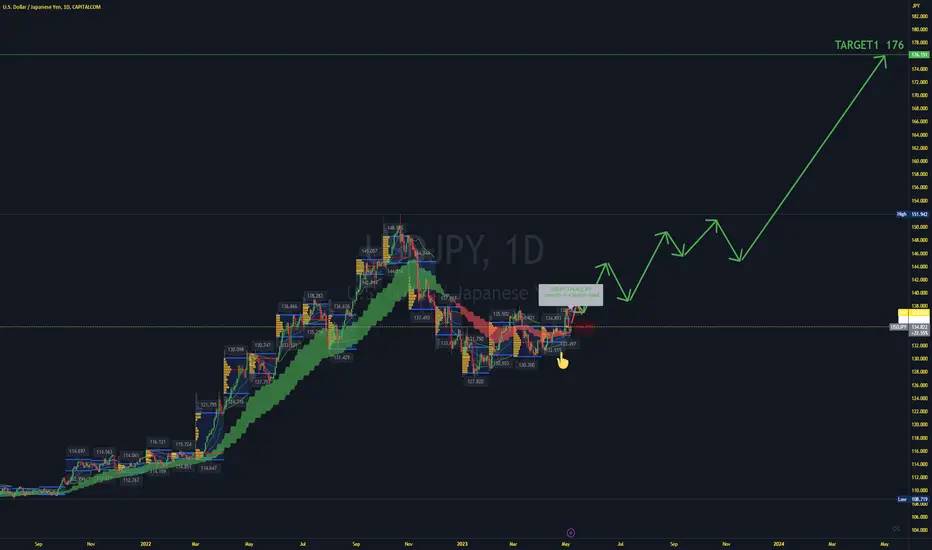
Bank of Japan's Dovish Line Pushes Yen DownSTRATEGY LONG TARGET 175USD YEN
The market thinks the Bank of Japan’s new governor is negative for the yen and a plus for stocks, at least based on his first policy board meeting.
In fact, the headline NFP print showed that the US economy added 253K new jobs in April against 179K anticipated, offsetting the downwardly revised reading of 165K. Adding to this, the unemployment rate unexpectedly fell to 3.4% during the reported month from 3.5% in March, which assists the US Dollar (USD) to regain strong positive traction and provides a goodish lift to the USD/JPY pair.
Apart from this, a positive turnaround in the global risk sentiment - as depicted by a goodish recovery in the equity markets - undermines the safe-haven Japanese Yen (JPY) and further contributes to the bid tone surrounding the USD/JPY pair. That said, the Federal Reserve's (Fed) less hawkish stance holds back the USD bulls from placing aggressive bets and keeps a lid on any further gains, at least for now.
Nevertheless, the USD/JPY pair, for now, seems to have snapped a three-day losing streak and stalled this week's sharp retracement slide from the 137.75-137.80 region, or a two-month high. Spot prices, however, remain on track to register losses for the first time in the previous four weeks. This makes it prudent to wait for strong follow-through buying before placing fresh bullish bets around the major.
After Gov. Kazuo Ueda presided over his first meeting, the bank emphasized that it would continue monetary easing to support growth in wages and prices. That was enough to persuade market players that an interest-rate increase isn’t in the cards soon.
Late Friday in Tokyo, the yen was trading at around 136 to the dollar, compared with around 134 to the dollar before the central bank’s midday decision.
The USD/JPY pair catches aggressive bids during the early North American session and jumps to the 135.00 psychological mark in reaction to the stellar US monthly employment details.
USD BULLISH
When the dust settles, the Fed is set to continue raising rates
US to have permanently higher rates than elsewhere
Re-acceleration of inflation and its win over the Fed will continue to catch the market by surprise
The Dollar is higher for longer, alongside the Fed’s narrative
Stagflation to take USD even higher
Hot CPI means the Fed pivot is well beyond the horizon
Ugly inflation promises further flight to safety
US at war means a stronger dollar
Outlook for Fed monetary policy now more hawkish
Powell projects pain, higher rates for longer set to keep the dollar bid
There is no alternative to the US dollar
No recession for America's labor market, more dollar gains eyed
Fed Chair Powell prioritizes fighting inflation, and ready to see negative growth
Long 
SPX & NQ - optimism is backWe had a rather treacherous 2.5 months of corrections since both SPX and NQ hit their peaks in July, resulting in a 50% and nearly 38% fib retracements respectively of both indices' major AB upswing in (Mar - Jul).
SPX breached its H&S neckline briefly before finding support near major support zone (comprising 200day MA, Horizontal support, VWAP, 50% fib retracement) around 4200. Nasdaq fared slightly better and did not breach its H&S support, but teetered on the brink for days before the bulls finally won as it staged a sharp rebound last Friday.
Market breath is still mixed with Nasdaq100 leading the pack with 61% of the stocks above their 200day MA (ticker: NDTH), followed by S&P500 with only 40% of the stocks above their 200day MA (ticker: S5TH) and finally, Russell200 is weak with only 31% of its stocks above their 200day MA (ticker: R2TH).
With such mixed market breaths, stock picking skills is paramount.
While there are still a lot of strong/resilient counters out there (GOOG, META, AFL, ANET, APP, BAH, CLS, CRWD, LLY, VRT, ZS etc), there are also a lot of very weak counters that are now sweeping their (major or range) bottoms (CL, DIS, DOCU, DG, EL, RH etc). Plus many in between trying to breakup from their bases but with mixed results.
As of now, the last quarter could more bullish than not, and , and knowing when to exit or sit tight. Market participation is still rather weak at the moment and volatility appears to be the new game for this high inflation era. Hence it could still be challenging to find the right stocks at the right time (entry and exit).
Momentum/swing traders would prefer the strong stocks that continue to break higher after each retracement. The longer term investors might be more interested to do some bottom fishing (however, may risk picking a stock could remain at the bottom for a long time due to serious near term fundamental damage). For myself (swing trader), I would prefer to at least choose a stock that has broken up from a base, or to swing in and out of a strong stock.
The extreme volatility means I could be swing in and out more often than I would have prefered. And money management rules (stop loss etc) must be adhered to (easier said than done!)
Disclaimer:
This is just my own analysis and opinion for discussion and is NOT a trade advice. Kindly do your own due diligence and trade according to your own risk tolerance and don't forget that money management (ie trailing stop loss and position sizing) is (probably the most) important!
Take care and Good Luck!
 Long
Long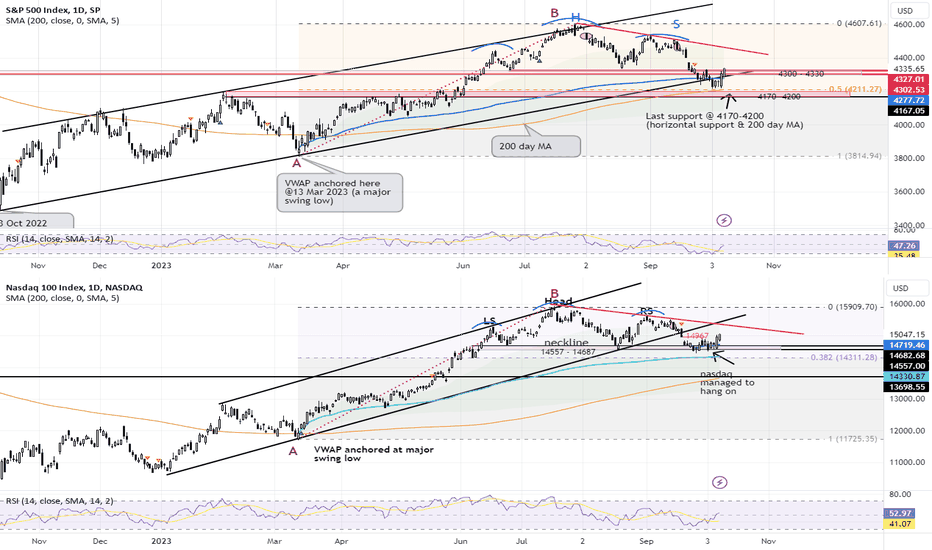
Short 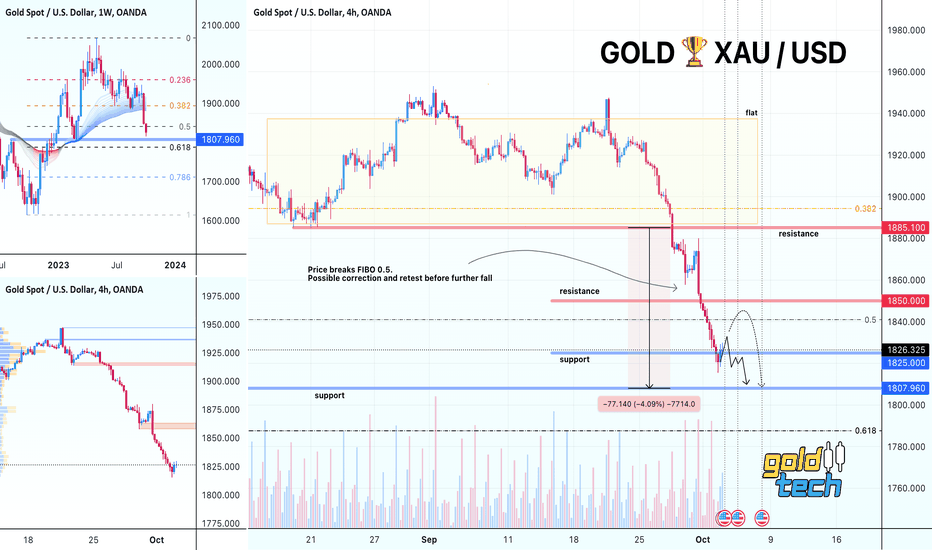
Short 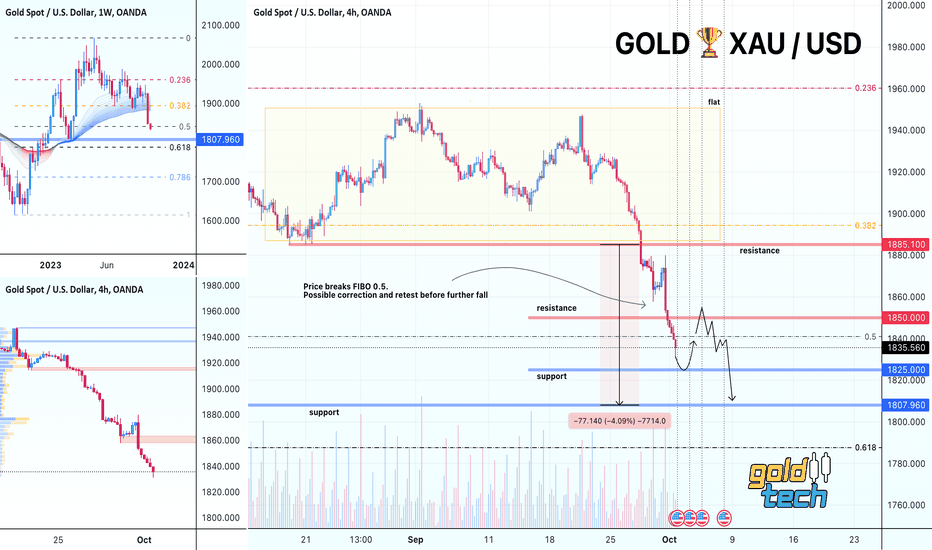
GOLD →The market doesn't feel supported. Further ↘︎OANDA:XAUUSD is in a strong distributive phase, the price is not even stopped by the 1885 level (liquids area). The price is updating the low amid negative fundamentals, as evidenced by strong weakness from buyers
On Wednesday, the market forms a paranormal candle, the closing of which suggests the continuation of the fall, the local level of 1875 and 1872.58 is formed. If this zone is overcome and the price consolidates below this area, a bearish potential will be formed. But before the further fall, the market-maker may make a rebound to increase the liquidity. In the correction phase the price may reach such zones as: 1880, 1885 !!, 1890. But, it is worth paying attention to the D1 chart, the price is breaking the support of the symmetrical triangle, now the market has entered the phase of realization of the accumulated potential. On the background of bullish news for the TVC:DXY , the XAU price entry into the empty range can only accelerate its fall to 1800. This level is the nearest significant one. At the moment it is difficult to talk about buying, the medium-term market is ready to fall. We continue to follow the price
Support levels: 1875, 1872,5
Resistance levels: 1880, 1885, 1890
Market is red, DXY is being pushed up on the back of unstable inflation. Gold is not feeling strong support levels, suggesting weak buying power
OANDA:XAUUSD COMEX:GC1! COMEX_MINI:MGC1! OANDA:XAGUSD COMEX:SI1! TVC:DXY
Regards R. Linda! Short 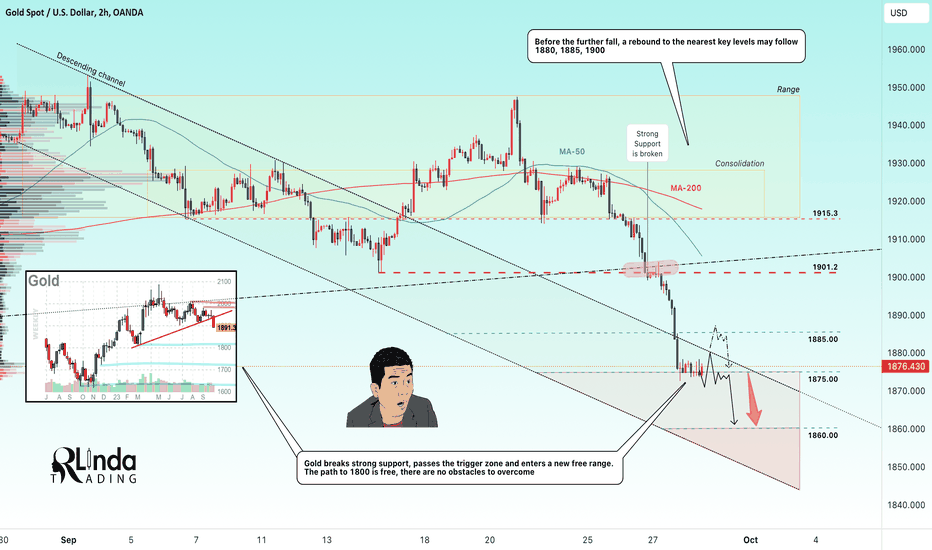
Long 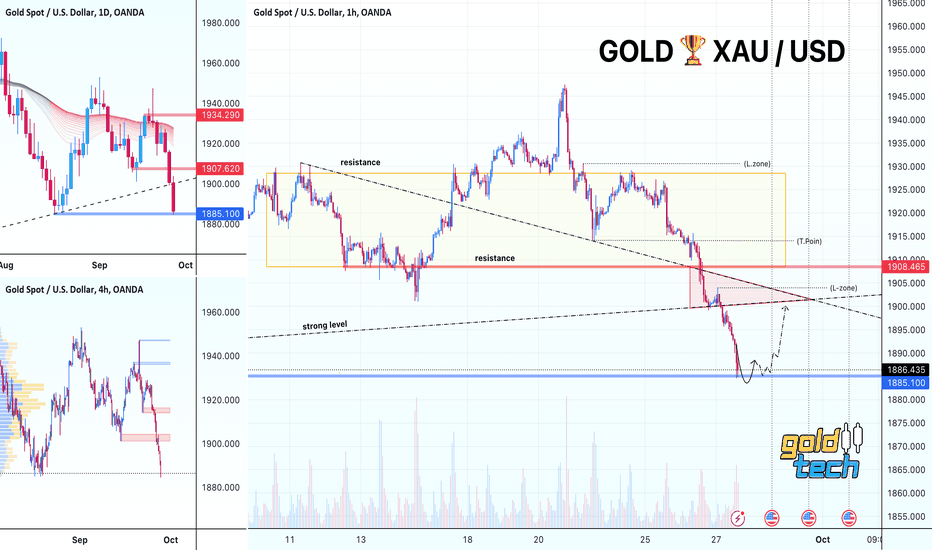
GOLD → Bearish Pin-Bar on Negative Fundamental Background OANDA:XAUUSD is testing the upper boundary of the global descending resistance again at the end of last week. The retest occurs at the moment of strong news, but the key candlestick pattern is formed exactly at the moment of FED & FOMC speech, as a result of which the market determines the further prospect of strengthening the dollar and hence - the fall in the price of gold.
In the coming week the market is expecting a lot of important news and I recommend to pay attention to Thursday and Friday. Lots of data that can determine the medium term pespectives for us.
For example:
GDP (QoQ) (Q2)
Initial Jobless Claims
Fed Chair Powell Speaks
Core PCE Price Index (YoY) & (MoM)
Based on the FOMC position from last week we have some views on the market at the moment, but confirmation is also needed.
As for the market situation. I recommend to pay attention to the dollar. During the publication of the data the index only fixed above the level I mentioned earlier and after that it starts to form an impulse. The price opens a corridor to the side of 106 and 107.99, in this case this growth of the TVC:DXY will give a huge potential for a fall in the price of gold. The nearest target support in the medium term is the level of 1902.8.
On the chart above, I have indicated several important levels to pay attention to as the price approaches them. From a global perspective, gold is in a consolidation phase, as evidenced by the monthly chart on the main screen. A strong accumulation zone is forming relative to the resistance area.
In the coming week, I expect a fall towards the 1915 side or even 1900. As we see a sideways range forming and a deep false breakout of resistance with huge liquidity below 1910, this clearly defines the future prospects for the market maker.
Most likely the medium term outlook at the moment is that the market is ready to lose ground further, how long this will hold is unclear, but it all depends on the world view (especially the US) on inflation
OANDA:XAUUSD COMEX:GC1! COMEX_MINI:MGC1! OANDA:XAGUSD COMEX:SI1! TVC:DXY
Regards R. Linda! Short 
Short 
Short 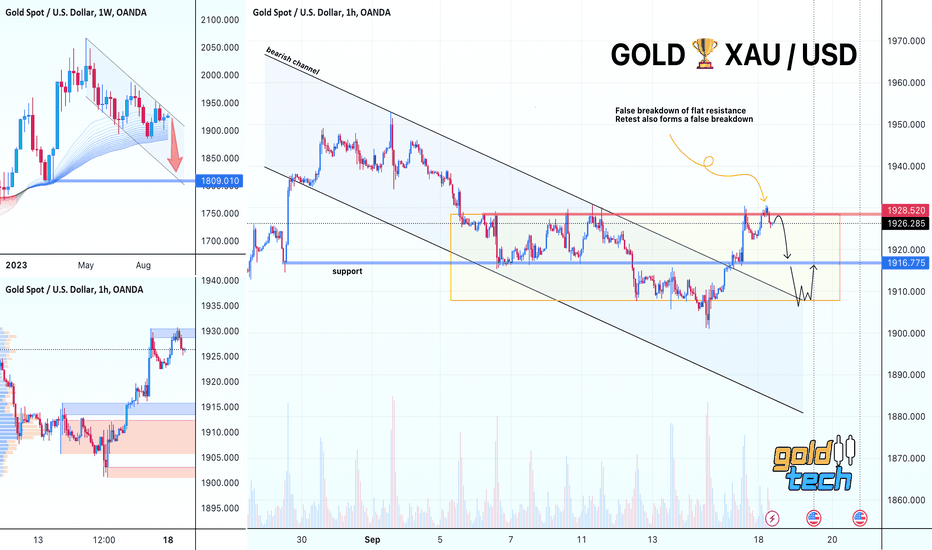
Short 

 Short
Short

 Short
Short