GOLD → Strong dollar influences further decline in gold OANDA:XAUUSD , following my expectation, on the background of Friday's NFP falls and reaches the target. The price is testing the level of 2000, but in my opinion, this target will not end this week.
From December 11 to December 15 we are expecting a rather active week, fundamentally. On Friday we got a rather strong NPF for the dollar, which made gold fall from the zone I mentioned. The fundamental potential is not over, it will continue to influence the pricing in the medium term. It is
Pin Bar
EURUSD → Correction before the news. What could happen?FX:EURUSD is forming a false breakout. This may be the reason for the formation of correction in the short term. The market is also expecting news today, which is worth paying attention to.
We are interested in CDGO (MoM) today and the one that may affect the price in the short to medium term is Initial Jobless Claims. For the latter, analysts are expecting an improvement in the indications from 231K to 225K. If the actual data released at 13:30 GMT is higher than expected, the correction m
USOIL - BEARISH MOVE 📉
As We Talked in The Previous Analysis:
On Tuesday 7 November, The USOIL Price Broke The Support Level (79.72 - 77.64).
This Support Level Becomes a New Resistance Level.
Currently,
The Price pull back to important Resistance Line,
And Formed a Bearish Pin Bar 📉
-----------
TARGET: 75.60🎯
DXCM - bottom fishing (swing trade)DXCM had been essentially a range bound stock in the past 3 years, forming what is potentially a long term head & shoulders formation (bearish if break down). However, it looks like the odds of breaking down has diminished with a bullish monthly pin bar now forming after finding support at its 88.6% fib retracement (imperfect double bottom).
The stock is still below its 200 day MA but this MA is less relevant for a stock that is just ranging sideways for the past few years. It can still be a
Daily pinbar candle. Fundamental still bullish?!Hi guys. Last week was again a week full off strong bullish momentum. Even the big resistance levels couldn't stop the massive bullrun. The market is overal more moving on fundamentals then technicals. The war going on is making the precious metal in big demand.
I adviced traders to be carefull with selling the market. Intraday/swingtraders having a hard time shorting the market atm.
If we look at the friday daily closing. We can see a big pinbar. 1983-1985 is big resistance level. It broke i
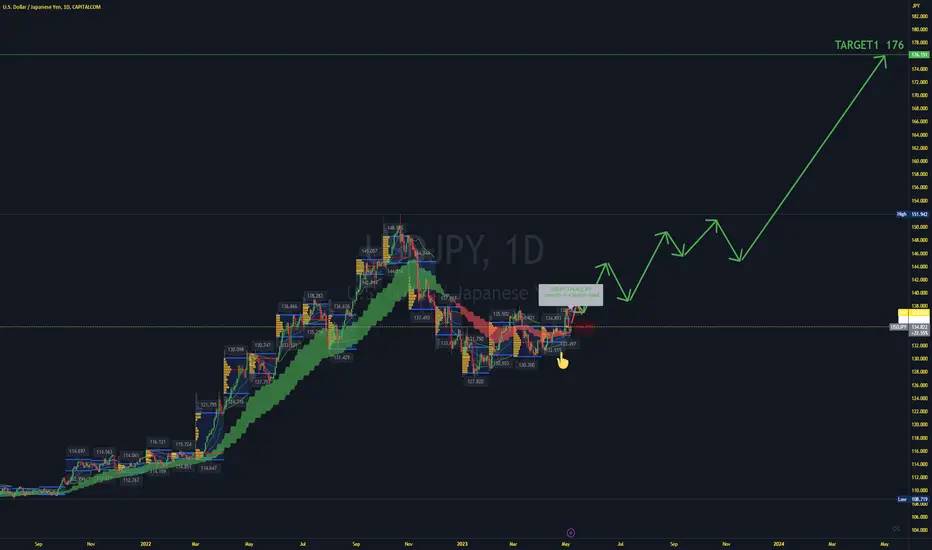
Bank of Japan's Dovish Line Pushes Yen DownSTRATEGY LONG TARGET 175USD YEN
The market thinks the Bank of Japan’s new governor is negative for the yen and a plus for stocks, at least based on his first policy board meeting.
In fact, the headline NFP print showed that the US economy added 253K new jobs in April against 179K anticipated, offsetting the downwardly revised reading of 165K. Adding to this, the unemployment rate unexpectedly fell to 3.4% during the reported month from 3.5% in March, which assists the US Dollar (USD) to regai
💱 NZDUSD - Head and shoulders. Bear potential NZDUSD is forming a false breakout and reversal pattern. There is an opportunity for a decline to 0.59000
TA on high timeframe:
1) False breakout of global range resistance
2) The market considers liquidity in the area of 0.59600 as a target
TA on low timeframe:
1) A false breakdown in the "head and shoulders" format is formed
2) Price starts realization of the pattern after breaking its base
3) I am waiting for a fall to 0.5985 and 0.59600.
Key support📉: 0.5985
Key resistance📈: 0.60000
🥇GOLD - The market may strengthen the price GOLD has been rising since the opening. The reason is the conflict in the Middle East and the fundamental factors of last week.
Consolidation is forming and most likely the price may test the support before further growth.
TA on the timeframe:
1) The reason for the rise today is the geopolitical factor. And as we know, in all crisis situations there is a growing interest in gold.
2) False breakout of strong 0.5 fibo level. FB may be followed by strong growth
TA on the low timeframe:
1) Price
SPX & NQ - optimism is backWe had a rather treacherous 2.5 months of corrections since both SPX and NQ hit their peaks in July, resulting in a 50% and nearly 38% fib retracements respectively of both indices' major AB upswing in (Mar - Jul).
SPX breached its H&S neckline briefly before finding support near major support zone (comprising 200day MA, Horizontal support, VWAP, 50% fib retracement) around 4200. Nasdaq fared slightly better and did not breach its H&S support, but teetered on the brink for days before the bu
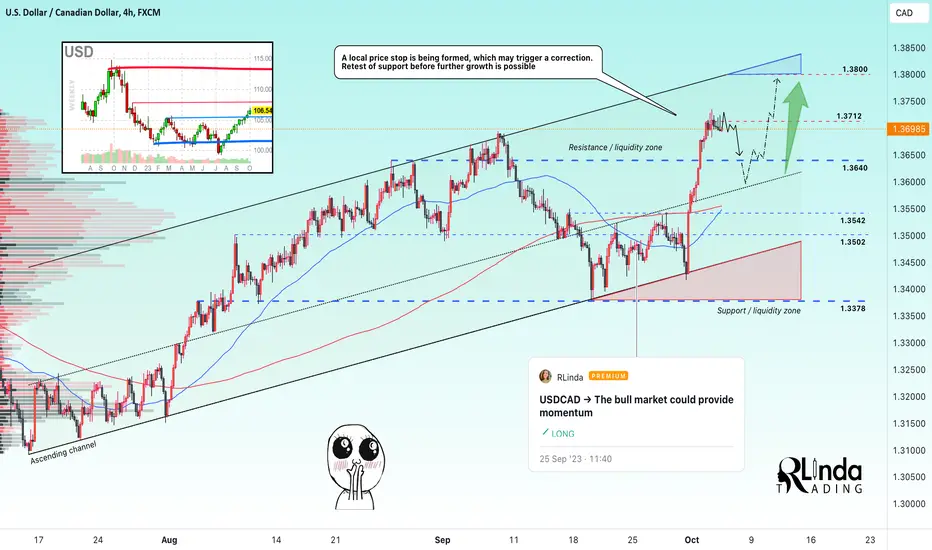
USDCAD → Growth may continue after correction FX:USDCAD is forming an impulse from the base of the ascending price channel. When breaking through the resistance mentioned earlier, we see active strengthening, which is also supported by the fundamental component
The TVC:DXY is in a bullish trend, as evidenced by the weekly chart on the left. The price is chasing a rise towards 107.5, which will make the currency pair strengthen.
On the USDCAD chart we see a local stop in front of the resistance at 1.3712, consolidation is forming, wh
🥇GOLD - The fall may continue, but after a small correction Gold reaches the specified level and forms a false breakout attempt. A rebound may be formed. But there is a chance of a continuation of the fall from the level of 1825.
TA on the high timeframe:
1) Broken 0.5 fibo level. A strong fall is formed from the opening
2) The liquidity area that the price can test within the counter-trend correction is in the area of 1840-1850.
TA on the low timeframe:
1) We have a strong downtrend
2) The price cannot fall all the time. If there is a false breakout
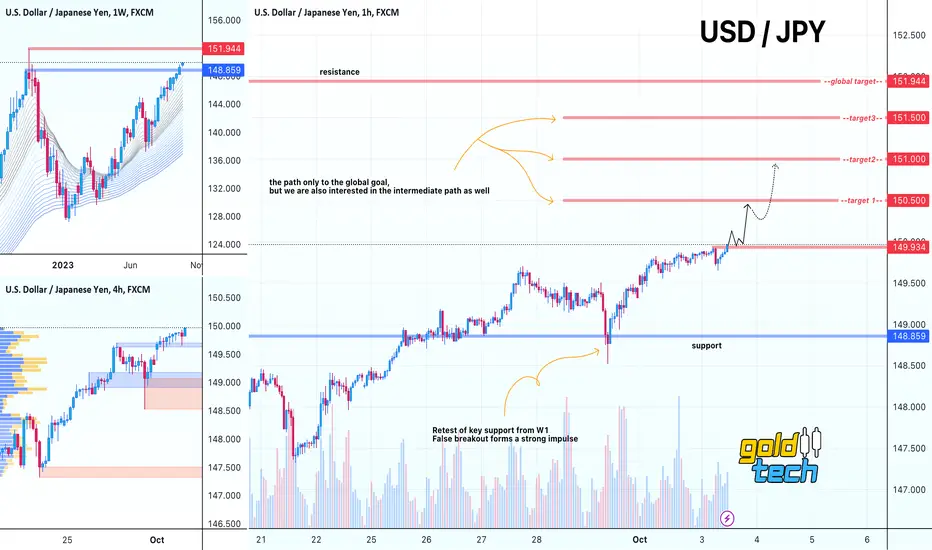
💱USDJPY - Active bullish trend. Target 152.00.USDJPY continues to go to its target. The market is interested in the mark of 151.95. Against the background of a strong trend, we should look for either support levels and buy on the bounce, or resistance levels and buy on the breakout.
TA on the high timeframe:
1) Strong pattern on d1. V-turn pattern. Price is breaking through the base, which is a strong medium term signal
2) There is a void ahead and liquidity area only around 152.00
TA on the low timeframe:
1) A retest of 148.86 support is
🥇GOLD - The buyer is out of the market. A big drop Gold is forming a strong decline. The price is breaking support levels without any particular reaction from the buyers. The decline is likely to continue until gold finds strong support
TA on the high timeframe:
1) The market is breaking the 0.5 fibo area and forming further momentum. One of the key support levels may be tested soon
2) An area of liquidity that can stop the price still far away
TA on low timeframe:
1) The 0.5 fibo is broken, at 1840.9.
2) Price is heading towards 1825, a corr
GOLD →The market doesn't feel supported. Further ↘︎OANDA:XAUUSD is in a strong distributive phase, the price is not even stopped by the 1885 level (liquids area). The price is updating the low amid negative fundamentals, as evidenced by strong weakness from buyers
On Wednesday, the market forms a paranormal candle, the closing of which suggests the continuation of the fall, the local level of 1875 and 1872.58 is formed. If this zone is overcome and the price consolidates below this area, a bearish potential will be formed. But before the fu
🥇Gold reaches important support. Waiting for a reboundGold is reaching an important goal for us. We've been waiting for this. A test of the level of 1885.100 is being formed. On the background of distributive fall and strong sell-offs, a rebound may occur.
TA on the high timeframe:
1) A huge pool of liquidity is formed below the level of 1885, most likely, a false breakout should occur before the rebound
TA on the low timeframe:
1) The false breakout could be quick (a few 5-minute sections) or it could be a long one
2) Either way it should be ex
GOLD → Bearish Pin-Bar on Negative Fundamental Background OANDA:XAUUSD is testing the upper boundary of the global descending resistance again at the end of last week. The retest occurs at the moment of strong news, but the key candlestick pattern is formed exactly at the moment of FED & FOMC speech, as a result of which the market determines the further prospect of strengthening the dollar and hence - the fall in the price of gold.
In the coming week the market is expecting a lot of important news and I recommend to pay attention to Thursday and F
🥇GOLD - Selling off on weak news. Pin-bar Gold is losing almost 1.5% amid sell-offs. Yesterday, before the FED speech, the market maker strengthened the price to 1947.3. The news was strong for the dollar and weak for gold, thus we see a strong sell-off and at the moment the price is at 1919.5.
Ta on the high timeframe:
1) False break of resistance at 1934
2) A strong candlestick pattern is formed for further selling.
3) A pin-bar is formed on the background of the false breakout. Target 1900
TA on the low timeframe:
1) False breakou
🥇GOLD - False breakdown forms a double top Gold on Friday forms a false breakdown of flat resistance (indicated on the chart). On Monday, the market forms a retest of the upper boundary and forms a false breakout again.
TA on the high timeframe:
1) The market is still continuing to form a bearish trend
2) A retest of the liquidity area forms a false breakout, indicating buyer weakness at the moment.
TA on the low timeframe:
1) Consolidation under resistance is forming. The market is preparing to fall
2) Within the flat we have the fol
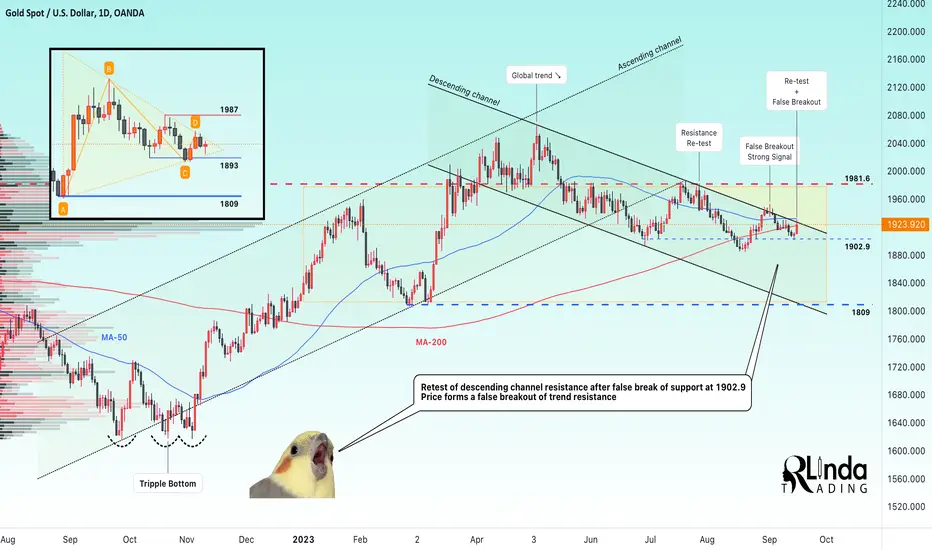
GOLD → Another false breakout on resistance retest OANDA:XAUUSD is weakening after a resistance retest that ends in a false resistance breakout. Yesterday, in Sunday's XAU idea, I talked about prioritizing a further drop as the dollar is poised to rise further and gold forms a false break of trend resistance
Price is back under a strong descending resistance line. Consolidation below this line will form a strong bearish potential.
The TVC:DXY forms a retest of 105.00, a fairly strong resistance that holds the price for a long time. This w
GOLD → The certainty of a strong market or the trap of MM?OANDA:XAUUSD is strengthening at the end of the week and closed above Monday's open. BUT! The dollar is also strengthening and on the chart we see several key elements forming and an important zone that can give us strong signals.
In the coming week, the following news is worth paying attention to:
09.19
CPI (YoY) EUR
09.20
CPI (YoY) USD
FOMC
FED
09.21
Initial Jobless Claims
FED
09.22
S&P Global Services PMI
It is worth paying attention to the W1 dollar char
RUNEUSDT → A retest of resistance could break the line BINANCE:RUNEUSDT gives us new prerequisites for further strengthening of the price. Another resistance retest is forming, which can break this zone on the background of local BINANCE:BTCUSD growth
Several key elements are marked on the chart. The descending wedge, resistance retest, pre-breakout consolidation - all this can be regarded as a complex signal for a breakout of resistance. On the background of bitcoin's local strengthening, which occurs after breaking out of resistance, this
🥇GOLD - Correction to previously broken support Gold is forming volume density on the resistance side which is pushing the price down. We are seeing a strong bearish trend that continues to conquer the lows
TA on the oblique timeframe:
1) Price is in a bearish channel and is aiming for the nearest strong support area in the medium term - 1809
2) Within the near term target, price may reach 1885 within a few days.
TA on the low timeframe:
1) A retest of the resistance area sends price down again
2) Support at 1909.85 is broken and a correc