US30/DJI morning analysisTechnical analysis for US30 (DJI).
Two bearish counts, both have corrective expanded flat for wave ii or b.
Price tagged .5 fib retracement from ATH to 5 August low, tagged median line target with reaction/profit taking seen last week.
There could be more upside towards ATH to complete the ((c)), but with these bearish counts suggesting either a zigzag or impulse down from ATH, 45105.1 should hold as hard resistance, and both these counts would be invalid with new ATH.
Risk/reward attractive
Pitchforks
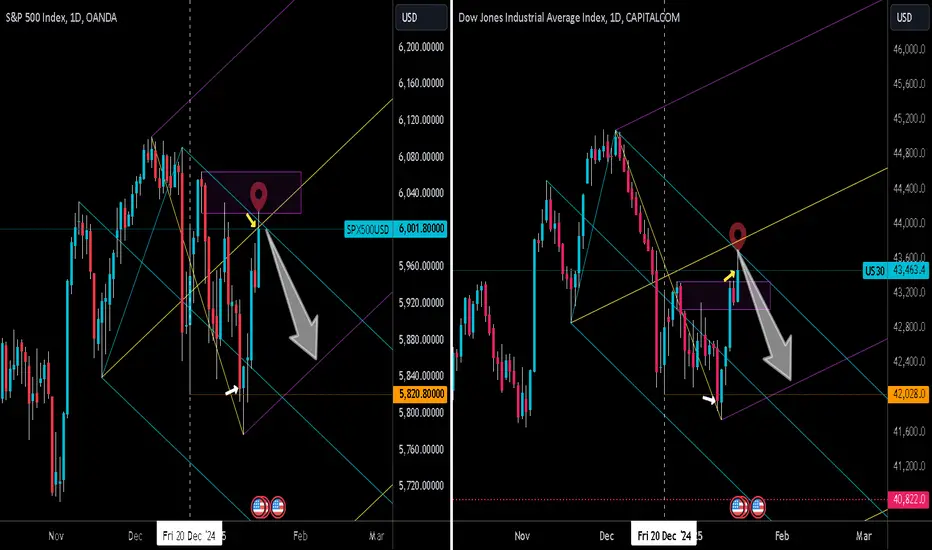
S&P500 & US30 Active DivergenceDivergence does not always have to be observed through the lens of a lagging indicator. Closes do provide powerful signals as to when a move is likely to reverse direction. They also allow us to enter with a smaller risk.
Lets first compare the previous swing lows marked out on both charts (dotted orange horizontal line) on the 20th Dec 2024. Zoom in on the white arrows! What do you see with the closes?
Now focus in on the S/R zone in purple. Notice that the block width is created from the hi
Closing above Mother line & Pitchfork median line unsuccessful.Nifty tried hard to close above Mother line of 50 Weeks EMA and Pitchfork median line this week but was unsuccessful. Closing above 23433 is imperial for Nifty to gain a bullish momentum. Pitchfork is used to determine the long term trend of Nifty. In this particular chart the Pitchfork starts from 2021 and extends till 2026 end. The upper side has lot of potential as you can see the top is leading towards 32.5K+. Even the Median line is leading towards the target close to 29K. Supports for Nift
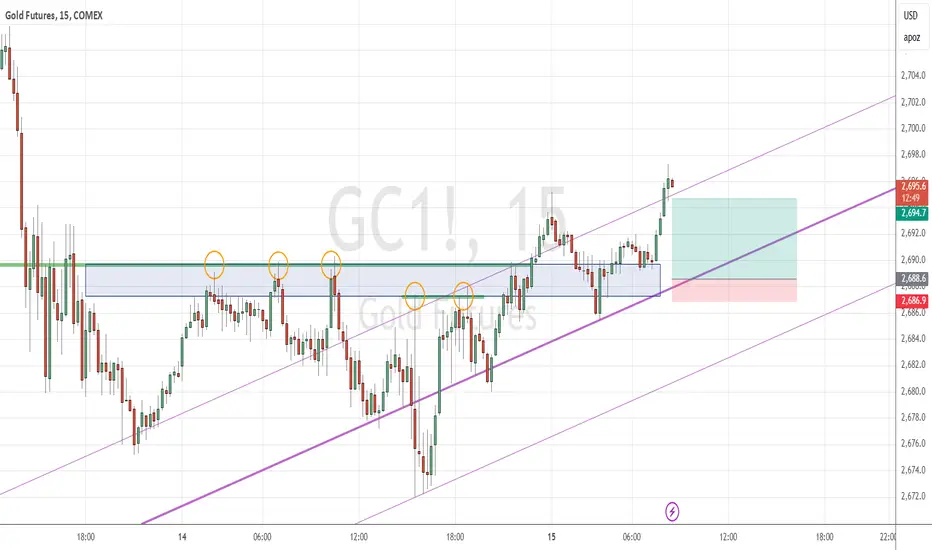
Local GOLD long from an action line on 15m chartPrice has broken kill-zone that consists of triple top and double top. So I expect stepping up swing movement on 15m chart. This is a good time to draw action-reaction set. It captures previous price movements wonderfully.
And we have nice risk/reward entry if we place our stop behind this kill-zone
USOIL, evening analysisTechnical analysis of USOIL (CL1!).
Bullish (green) and bearish (red) counts for USOIL.
Price likely to rise towards resistance at 94.99, with median line of pitchfork as target.
Bulls see EW count in a wave 3, with price to challenge 2022 highs and keep 94.99 as support once it breaks as resistance.
Bears see a wave c in progress, to complete a zigzag X in the 96.5-105 area, then roll back down with a Y below 63.61.
Bitcoin Market Cap PitchForksCRYPTOCAP:BTC
Setup PitchForks for each cycle, starting at the low. Looks to be good high touchpoints and trendlines to follow. Interested to see this current PitchFork have more touchpoints and then move back into the 2021 PitchFork at high valuations, entering the 2021 PitchFork around 4 to 5 Trillion in Market Cap.
COINBASE:BTCUSD CRYPTOCAP:BTC
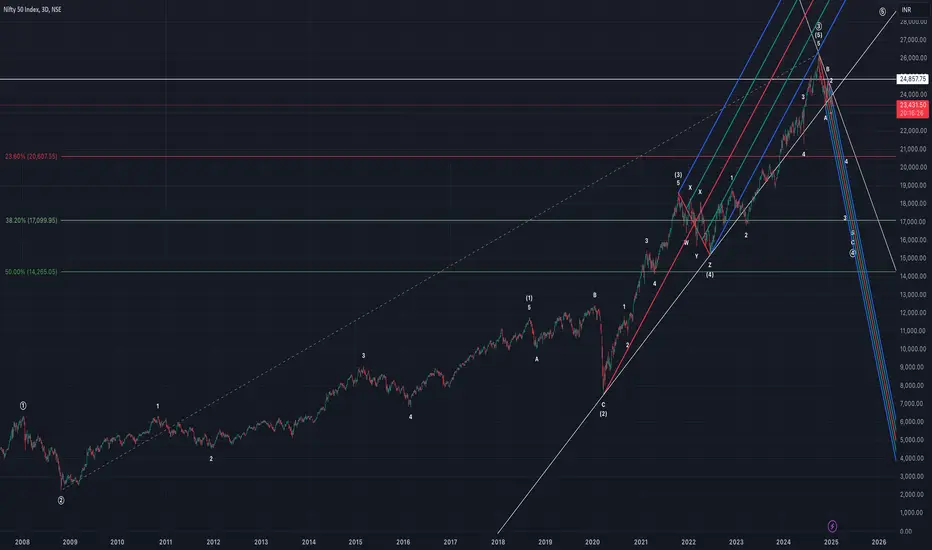
NIFTY technical analysis, big pictureTechnical analysis for NIFTY 50 Index.
This count has price in price in wave c of Primary wave 4. The a and b wave of the zigzag may need to be adjusted, depending on how price moves down to target, which is the 15000-17000 area.
Price never tagged the median line of the bullish pitchfork, did its best to stay above its bullish Hagopian line. As price continues to stay below 24857.75 (which is now key resistance), gravity should pull price down rather quickly towards target.
ETHUSD morning analysisTechnical analysis of ETHUSD.
Bearish count sees large regular flat from ATH, pitchfork drawn from ATH, A, and B.
C wave would be in its wave 3, with target ~2000.
Wave 2 was a zigzag with Elliott Triangle wave b. Wave c of 2 tagged .618 fib drawn from B at 4104.56 to end of wave 1 of C.
Smaller pitchfork drawn from B, 1, and 2; convergence with larger pitchfork below A at 880.03, which is where this analysis suggests price is going.
NAS100/NDX morning updateAnother look at NAS100.
I added another pitchfork and Hagopian line, drawn off bearish pivots after 16 December 2024 ATH.
The Hagopian line held resistance at wave ii. As long as it continues to hold as resistance, the red median line is the bearish target. Failure of the bullish pitchforks to hit their median line targets suggests price reversal.
Two bearish counts after ATH. Count in green shows a zigzag, and count in red shows an impulse. The red count assumes that price completed a (b) wa
NAS100/NDX technical analysisTechnical analysis for NAS100 (NDX).
Price shown from 5 August 2024 low.
This count sees price as an ending diagonal from 5 August 2024 low, with a truncated fifth wave finishing at 22084.70.
Completed impulse wave from 22084.70 to 20710.70 (first green ellipse).
Regular flat completed at 21654.70, with impulsive price action afterwards (second green ellipse) which broke below support of 20710.7 today.
Two pitchforks shown, neither of which had their median (red) lines tagged, implying pric
US10Y afternoon analysisTechnical analysis for US10Y.
Bearish on long-term bonds, this analysis has yields continuing to go up.
Displayed count has A wave beginning off 9 March 2020 low, completed 23 October 2023. B wave as completed zigzag to September 17 2024 low.
C wave count in wave 3 of 3, with targets of 5.337% and 5.592%. This count shows C wave completing at top of pitchfork (drawn off 9 March 2020 low), but with measured move I would expect the C wave to complete north of 6.496%.
Key supports: 4.507% and 4
AGLDUSDT Long Setup - Spot BINANCE:AGLDUSDT
📈Which side you pick?
Bull or Bear
Low-risk status: 3x-4x Leverage
Mid-risk status: 5x-8x Leverage
(For beginners, I suggest low risk status)
👾Note: The setup is active but expect the uncertain phase as well. also movement lines drawn to predict future price reactions are relative and approximate.
➡️Entry Area: 1 step now
Yellow zone: 2nd step = 2.61-2.32
⚡️TP:
3.13
3.55
4.13
🔴SL:
1.99
🧐The Alternate scenario:
If the price stabilizes against th
USD/JPY Short using a GANN Fixed Square & Andrews PitchforksWe have an interesting short setup on the Daily. The highest candle printed was on the 26th Dec 2024 (UTC+2). Although it wasn't a nice 'Signal' candle it has traded sideways ever since. From a technical/geometric lens we can see heavy resistance against the angles and arcs of this perfectly scaled Gann Fixed Square including 2 median line touches and a "sliding parallel" exhaustion gap. Note: The 26th Dec from an Astro perspective has very interesting planetary alignments including a Price and
Ethereum Bullish Outlook: Targeting $8,000 During Altcoin SeasonBINANCE:ETHUSDT
COINBASE:ETHUSD
📈Which side you pick?
Bulls or Bears
SL1 ---> Low-risk status: 1x-2x Leverage
SL2 ---> Mid-risk status: 3x-4x Leverage
(If there is just one SL on the chart, I suggest, low risk status)
After the alt-season scenario occurs, a very likely target for ETH/USDT is around $8,000. Currently, the price is stabilizing, and if it remains within this zone, a strong breakout could drive the price up to the $8,000 target.
In another scenario, if the
TOTAL2 Index Set to Surge Towards $2.5 Trillion!CRYPTOCAP:TOTAL2
📈Which side you pick?
Bulls or Bears
This chart shows the gravity points for the TOTAL2 index. It also describes the potential targets and their different probabilities of realization. The nearest zones within this structure are highlighted in green.
After TOTAL2 broke above 1.29 trillion dollars, and with Bitcoin Dominance (BTC.D) decreasing, a very likely scenario for TOTAL2 is reaching the 2.5 trillion-dollar level.
⚡️Target:
2.5T
GOLD & SILVER Short ideaHi,
We have an interesting bearish idea with the metals GOLD & SILVER. Being highly correlated we are able to extract confirming bearish signals of a turn next week. Price action shows selling pressure is greatest in Silver ( The Divergence Circle ) creating a vacuum against the yellow dashed horizontal line where GOLD has closed the GAP against the same line. Apart from this the same can be observed on the horizontal plane with Silver failing to reach the yellow diagonal frequency line showing
DXY afternon analysisLong-term analysis of DXY.
Bullish count sees double-combo of March 2008 low, W is a regular flat, X is a zigzag, Y would be a zigzag with target of ~128 and median line of pitchfork to complete wave C of Y.
This move would likely see US10Y targeting 8% in a long-term bond long-squeeze.
2025 Stock Buyback CrashI think there's going to be a major stock market crash now. I drew a Schiff Pitchfork connecting the peak and bottom of the 2008 subprime mortgage crash to the peak of Covid-19. Why? I'm looking at the geometry of how the stock market reacts to large systemic human problems. Notice that SPX is now overbought in exactly the same region as the 2000 dot com bubble crash.
What is this thing I'm calling the "Stock Buyback Crash"? Well without getting too political, the name of the game in Capitalism