How To: Bearish Breakaway w/ Tools, Indicators & StrategyHey everyone, thanks for joining! Below is the Quick Notes for the audio:
What is a Bearish Breakaway?
A Rare Reversal Candlestick Pattern that consists of 5 Candles, broken up into 3 parts:
Pt 1) Large Bullish Candle
Pt 2) 3 Small Bullish Candles
Pt 3) Large Bearish Candle (Confirmation)
What indicators can be used to Confirm?
1) Volume - Dwindles after the first Large Bullish Candle then Increases after the Large Bearish Candle
2) RSI - The reversal is part of a Bullish Divergence
Volume Indicator
C/USDT (1H) – Trendline Breakout & Demand Zone RetestThis setup presents a potential spot long opportunity on the 1-hour timeframe, supported by multiple technical factors aligning at a key area of interest.
Technical Logic:
Trendline Breakout: Price has successfully broken above the major descending trendline that had been capping upside momentum, indicating a potential shift in market structure.
Volume Profile Confluence: The breakout is supported by a strong demand zone (purple box) perfectly aligned with the Point of Control (POC) on
MBT1!: If all you have is a hammer, every problem becomes a nailI was always told that you need the right tool for the job. In trading, if the only tool you use is Price Action, you’re going to treat every move the same. But under the hood, not all price moves are created equal.
Look at these two charts of Micro Bitcoin Futures (MBT1!). On the left, we have the 4H, on the right the Weekly.
Despite the massive difference in timeframes, the "engine" is telling the exact same story.
In both cases, you can see price pushing higher. To some, this might look lik
MCL1! Volume Polarity is flashing the same warning that precededHistory doesn’t always repeat, but it often rhymes.
On March 20th, Volume Polarity showed clear signs of exhaustion:
Bullish volume reached extreme levels (red dots)
Raw volume differential crossed under the smoothed differential
Bearish divergences began printing (orange dots)
This was followed by a sharp $14.23 drop.
We are now seeing an almost identical setup after several days of sideways chop:
Bullish volume is once again pushing into extreme territory
Raw differential has c
MCL1! 1H Update: Volume Polarity Pattern Follow-UpLink to the original chart:
Yesterday we could see on the Volume Polarity indicator that the 1H MCL1! chart was repeating a pattern from a few days prior. Despite the similar setup, and strong (but temporary) wick down, the move never materialized.
Had you not hit your target on the corresponding wick down, how could you have known that the trade idea was dead?
Two things...
First, the Smooth Volume Differential (Yellow) never flips to the negative, and actually begins expanding to the upsi
NQ — Failing At Range LowNQ is sitting at the weekly range low.
Still inside the range.
Strong negative delta is pushing into the level with heavy volume.
Price keeps failing to close below it.
If that changes, the structure shifts.
Risk is tight here.
Exposure stays controlled.
No trade unless price accepts below the level or shifts on lower timeframes.
Engagement only after a clear break or reclaim.
CORE5DAN
DXY — Volume Node Test Near 100.663 Within Monthly RangeThe U.S. Dollar Index (DXY) is approaching the monthly bearish range high near 100.663, an area where elevated volume has previously appeared.
Price is moving toward this boundary from a higher-low structure at 98.349, indicating sustained volume participation inside the monthly range.
When price approaches areas of historically high volume, the market is testing whether the range boundary will hold.
The current environment reflects interaction with the upper boundary of the monthly range, wh
GOLD COLLAPSE
Instrument: XAUUSD (Gold) | Date: 31-Jan-2026
Context: ATH impulse → Friday liquidation → post-break value migration
Inputs: Your 15m / 1H / 4H / 1D / 1W / 1M charts + FRVP/FVRP map + volume footprint
EDUCATIONAL ONLY — Not financial advice — Not trade signals.
══════════════════════════════════════════════════════════════════════
1) EXECUTIVE SYNTHESIS (WHAT WE CONCLUDED THIS SESSION)
• Gold printed an ATH shelf around 5595–5597 (weekly/monthly high marker) then
collapsed violently on Fri
BNBUSDT — Bullish consolidation ahead of resumed uptrendThe bullish consolidation in BNBUSDT that I’ve been watching has begun to resolve in the market’s favor. Price action is coiling after two consecutive white spinning-top candles, a pattern that signals indecision but also a readiness to resume the prior trend when confirmed. The move has occurred on heavier volume concentrated in the current price area, and the pair sits roughly halfway between two key Fibonacci retracement levels — a location that commonly precedes a corrective bounce rather th
EUR/USD H1 Analysis: Key Supply & Demand Zones to Watch I SEP/231) Overview
Timeframe: H1 (short to mid-term trades).
Short-term trend: bullish (trendline up from Sept 22 low).
Current price: around 1.1798, overlapping with POC zone ~1.1799 (from volume profile).
Key zones:
Supply zone: 1.1814 – 1.1820 (strong resistance).
POC zone / balance area: ~1.1799.
H1 Support: 1.17606 (near-term support).
Demand zone: ~1.17236 (stronger support below).
2) Price Action & Market Logic
Price has been making higher highs / higher lows → bullish structure.
Volume prof
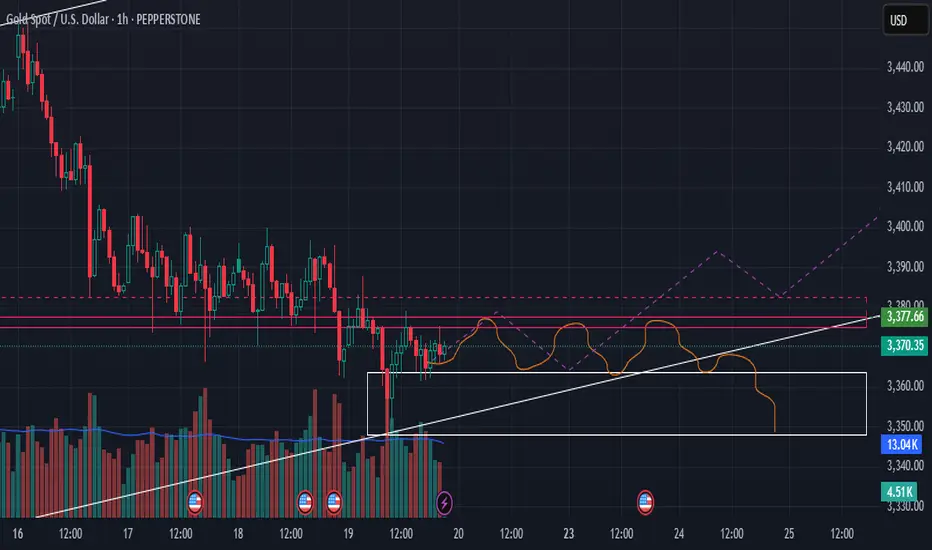
XAU/USD (Gold) – Educational Chart Breakdown [1H Timeframe]We’re currently observing a consolidation phase just below a well-tested resistance zone (~$3,377), while price remains supported by an ascending trendline — a classic setup where structure tightens before a significant move.
Two Potential Outcomes:
Bullish Case
If price closes convincingly above $3,378 with strong volume, we may see a continuation toward the $3,400–$3,410 zone. This would confirm the resistance break and shift market structure bullish on the 1H chart.
Bearish Case
Fail
What is a Bearish Breakaway and How To Spot One!This Educational Idea consists of:
- What a Bearish Breakaway Candlestick Pattern is
- How its Formed
- Added Confirmations
The example comes to us from EURGBP over the evening hours!
Since I was late to turn it into a Trade Idea, perfect opportunity for a Learning Curve!
Hope you enjoy and find value!
NVDA - 140 Quasimodo?Well NVDA has exceeded the 120 PoC from the last year, and other than the head and shoulders developing it looks rather bullish above that 120. But I would sell 140, or at least not buy.
And if I'm buying I'd probably wait for 112. Think I will wait forever? 😂
Will update after we get some more data.
Understanding Volume In TradingVolume is one of the most crucial yet often overlooked aspects of trading. It represents the total number of shares, contracts, or lots traded in a given period and provides insight into the strength of price movements. By analyzing volume effectively, traders can identify trends, confirm breakouts, and detect potential reversals before they happen.
Unlike price action alone, volume adds a critical layer of confirmation. A price move supported by high volume is more likely to be sustainable, wh
SHORT META Ahead of Earnings Report Based on Insider Selling"Meta Platforms Insider Sold Shares Worth $22,132,922"
Mark Zuckerberg, 10% Owner, Director, Chair of Board and Chief Executive Officer, on January 15, 2025, sold 35,921 shares in [eta Platforms. Following the Form 4 filing with the SEC, Zuckerberg has control over a total of 353,696 shares of the company, with 353,696 controlled indirectly.
Jennifer Newstead, Chief Legal Officer of Meta Platforms sold 905 shares of Class A Common Stock on January 14, 2025, at a price of $604.54 per
NSTR - Technical Analysis of Key Bullish and Bearish LevelsKey Observations:
Expanded Volume Profile:
The volume profile on the left indicates significant trading activity (support/resistance zones).
The high-volume node around 360–380 suggests a key area of interest where the price might consolidate or face resistance/support.
Bullish Levels:
Bullish Week (376): A breakout above this level could trigger upward momentum toward 400 and potentially higher.
Close Week Swing (363): Currently being tested. Sustained strength above this level would be a sig
BOMBAY DYEING - Ready to Move to the Next OrbitThe stock after facing price rejection in the range of 224 to 241 was pushed down to the 50 DMA. It moved almost sideways in the last three months. Recently we saw some interest coming back into the stock with the relative strength and the money flow turning positive and the volume was also increasing. The stock remained very strong during the recent weakness we saw in the overall market. Now finally it has crossed above the price rejection zone with good volume support. The delivery volumes saw
MAZAGON DOCKS - ON A RECOVERY PATH ?The stock after a buying climax bar in the month of July was overwhelmed with the supply of the BC bar and was pushed down to below the 50 DMA levels. Then it started accumulating around the 50 DMA and now it's finally getting pushed above the short-term moving averages. And all the key parameters like the relative strength, absolute strength, the money flow, buying pressure are all nicely stacked up favouring further up move. So, this could move up again. Another 1000 points testing 5400 levels
ICP Long Swing SetupThe chart suggests a bullish outlook based on the volume and price action. The significant volume spikes during rallies indicate strong buying interest.
The current low volume during the pullback phase supports the possibility of accumulation.
If the price breaks above the recent highs with increasing volume, it could signal the continuation of the uptrend.
traders await US CPI on ThursdayGold price remains confined in a narrow range as traders await US CPI on Thursday
10 January 2024
• Gold price extends its consolidative price move above a multi-week low touched on Monday.
•The Fed rate cut uncertainty is holding back traders from placing aggressive directional bets.
• Elevated US bond yields underpin the USD and cap gains ahead of the US CPI on Thursday.
Technical Analysis: Gold price bears await a break below the 50-day SMA support near $2,017 area
From a technical perspec