BITCOIN - Correction ahead of the rally to 83K...BINANCE:BTCUSDT.P , after a strong rally, has entered a consolidation phase. The market has not yet reached the technical pullback zone around 83K and could form a correction to build up liquidity before the next impulse.
Bitcoin has broken its global bearish trend but is still under selling pressure. We can start talking about a bullish market if Bitcoin closes above 83K and continues its upward momentum.
For now, the key focus remains on the broader 83K–60K range. The market is preparing to test resistance but has first entered a liquidity-hunting phase.
A false breakout of the 81,270 resistance level is triggering a correction, during which the market could test the 79,500–78,500 area
Resistance levels: 81,270, 82,460, 83,000
Support levels: 79,550, 78,650
The correction could extend toward the local trendline and the liquidity area below 78,800.
A long squeeze around the key trigger could then trigger a bullish impulse toward the technical pullback zone around 82,500
Best regards,
R. Linda.  Long
Long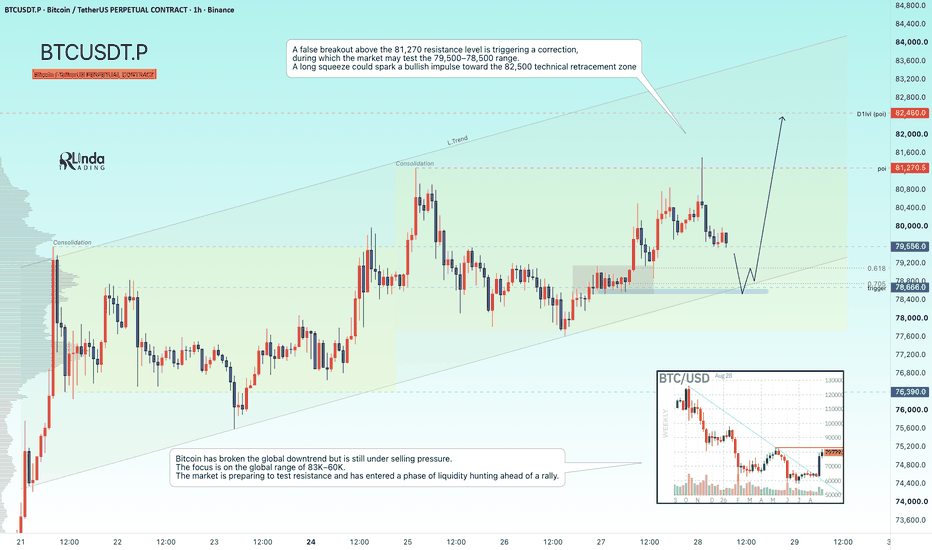
GOLD - The Hunt for Liquidity Ahead of a Rally ICMARKETS:XAUUSD continues its corrective phase due to the locally strengthening Dollar Index. On the D1 timeframe, price is consolidating above the intermediate range, and the market may give us an opportunity
The dollar is forming a counter-trend correction, which is also putting pressure on gold.
Gold maintains its bullish momentum amid a weaker dollar and positive medium-term market sentiment. The key events are the employment data and Waller’s speech. Technically, the target is a breakout above 4,697. Sustained upside is possible if the Fed maintains a dovish tone.
Drivers:
Upside: weaker dollar, lower rate expectations, falling oil prices, continued geopolitical tensions.
Downside: hawkish rhetoric from Waller, a stronger dollar, rising yields
Resistance levels: 4640, 4680, 4700
Support levels: 4600, 4595, 4583
Gold is trapped within the 4,585–4,640 range and, at the same time, inside a symmetrical triangle. The local trend remains bullish.
If the bulls manage to hold above 4,600, gold could move higher. Otherwise, a breakdown of the triangle structure could send gold toward 4,540. From that level, we could also expect a recovery phase toward 4,700
Best regards,
R. Linda.  Long
Long
GOLD - Consolidation. The trend may continueICMARKETS:XAUUSD is correcting from its 15-week highs on Tuesday amid a stronger dollar and heightened geopolitical tensions. The local bullish trend remains intact
The Dollar Index is forming a counter-trend correction, which is putting some short-term pressure on gold. The correction appears temporary, supported by easing rate expectations and technical support. The market is waiting for new signals
Drivers:
Downside: conflict escalation, higher oil prices and a stronger dollar, hawkish Fed signals.
Upside: weaker dollar, easing geopolitical risks, lower yields, dip-buying
Resistance levels: 4,680, 4,700, 4,720
Support levels: 4,630, 4,600
The local trend remains bullish. Gold is undergoing a corrective phase to build momentum ahead of a potential continuation higher.
Areas of interest: 4,720–4,775
Consolidation above 4,630 could become a technical catalyst for further upside toward the stated targets
Best regards,
R. Linda. Long 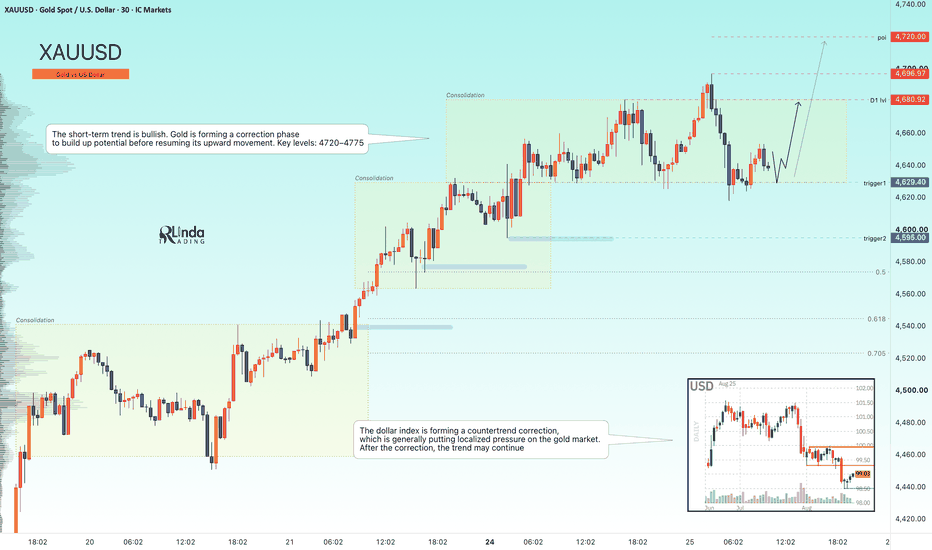
Long 
ETHUSDT - Consolidation could trigger further growthBINANCE:ETHUSDT.P remains relatively strong compared to Bitcoin. After a strong rally, the altcoin has entered consolidation near key resistance levels, which is a locally positive setup
Bitcoin is strengthening on the back of recent news and breaking out of its year-long bearish trend. Last week’s session closed favorably, and the lack of a deep correction increases the chances of further upside across the broader market.
After a strong rally and reaching a new high at 2,550, Ethereum has entered a consolidation phase, indicating strong buyer interest in further upside
Resistance levels: 2485, 2550
Support levels: 2423, 2356
Technically, the market could form a local long squeeze around the support zone before continuing higher. However, a breakout and close above 2,485 would open the way for a potential rally toward 2,550–2,620
Best regards,
R. Linda.  Long
Long
Market Move or Noise? A Quantitative Way to Tell the DifferenceA market moves 17,000 points in less than a week.
That sounds important.
But is it?
Price displacement alone does not tell us whether a move represents an unusual change in market behavior or simply the type of fluctuation we should expect from a volatile instrument. Volume does not necessarily solve the problem either.
The daily Bitcoin futures chart provides an interesting case study.
The standard TradingView Zig Zag indicator identifies alternating bullish and bearish waves. For every completed wave, we can observe information such as its starting price, ending price, absolute price change and accumulated volume.
The objective here is to use the identified waves to investigate if such waves represent a meaningful market event, or are they predominantly noise?
The answer becomes much more interesting once we stop looking at price and volume alone and introduce a variable that is surprisingly easy to overlook:
Time.
The 266K vs. 75K Volume Paradox
Consider two bullish waves visible on the chart.
An earlier wave moved from approximately 60,005 to 76,190.
Absolute price change: approximately +16,185 points
Total volume: approximately 266.31K
Duration: approximately 25 daily bars
The recent completed bullish wave moved from approximately 62,520 to 79,625.
Absolute price change: approximately +17,105 points
Total volume: approximately 75.6K
Duration: approximately 6 daily bars
If we compare only accumulated volume, the conclusion seems obvious.
266.31K is more than three times 75.6K.
One might therefore conclude that the earlier wave had dramatically greater participation and was consequently the more important market event.
But there is a problem.
The first wave had roughly 25 days to accumulate that volume. The second had only about six.
Instead of comparing total volume, consider trading activity per unit of time:
Volume Intensity = Total Wave Volume / Number of Bars
For the earlier wave:
Volume Intensity = 266.31K / 25 = approximately 10.65K per day
For the recent wave:
Volume Intensity = 75.6K / 6 = approximately 12.60K per day
The interpretation has changed completely.
Despite accumulating dramatically less total volume, the recent wave actually experienced slightly greater volume participation per day.
The 75.6K figure was not wrong. It was incomplete.
Time changed its meaning.
Now Ask How Fast Price Moved
The same adjustment can be made to price.
Both bullish waves produced similar total displacement. In fact, the recent move was slightly larger.
But one took approximately 25 days and the other approximately six.
We can define:
Price Velocity = Absolute Price Change / Number of Bars
For the earlier wave:
Price Velocity = 16,185 / 25 = approximately 647 points per day
For the recent wave:
Price Velocity = 17,105 / 6 = approximately 2,851 points per day
That is a very different comparison.
The recent wave produced slightly greater total displacement, comparable or slightly greater volume intensity, and accomplished that displacement approximately 4.4 times faster.
This is our first major clue that the recent wave may contain more information than its raw 75.6K volume initially suggests.
The market did not merely move far.
It repriced rapidly.
But 1,000 Points Do Not Always Mean the Same Thing
There is another problem.
Bitcoin's volatility changes substantially through time.
A 10,000-point move occurring during a quiet volatility regime can be extraordinary. The same displacement during an exceptionally volatile regime may be relatively ordinary.
Absolute price movement therefore needs context.
This is where Average True Range, or ATR, becomes useful.
ATR does not tell us direction. It provides a measure of the magnitude of recent price movement.
That allows us to express the size of a Zig Zag wave in volatility units:
ATR-Normalized Magnitude = Absolute Price Change / Representative ATR
Suppose, purely for illustration, that we use an ATR of approximately 2,000 for the recent +17,105-point wave.
ATR-Normalized Magnitude = 17,105 / 2,000 = approximately 8.6 ATR
Saying that the market traveled 17,105 points is informative.
Saying that the displacement represented roughly 8.6 units of prevailing daily ATR gives us considerably more context.
There is, however, an important complication.
Which ATR Should We Use?
ATR changes while a wave develops.
The chart makes this especially relevant because volatility expanded sharply during the latest bullish impulse.
Several choices are possible:
ATR at the beginning of the wave
ATR at the end of the wave
Average ATR throughout the wave
A representative ATR for the period
None should be confused with perfect measurement.
Using final-bar ATR can be particularly misleading when the move itself causes volatility to expand. We would effectively be evaluating the entire wave using a volatility condition that existed only near its end.
For a rigorous quantitative study, average ATR across the completed wave would generally provide a better representation of the volatility environment experienced during that wave.
Magnitude Still Isn't Enough: Add Velocity
Imagine two completed waves.
Both travel six ATR.
One takes 30 days.
The other takes five.
Are they really describing the same market behavior?
Clearly not.
This leads to a volatility-adjusted measure of velocity:
ATR-Normalized Velocity = Absolute Price Change / (Representative ATR x Number of Bars)
The same calculation can also be expressed as:
ATR-Normalized Velocity = ATR-Normalized Magnitude / Number of Bars
Using our illustrative 8.6 ATR magnitude and approximately six-day duration:
ATR-Normalized Velocity = 8.6 / 6 = approximately 1.43 ATR per day
Now we have something much richer than the original +17,105 label.
The market achieved net directional displacement averaging approximately 1.43 ATR per day over the completed leg.
This does not tell us what price will do next.
It tells us something about the character and urgency of the move that just occurred.
Volatility Woke Up Too
There is another feature visible on the chart.
Immediately before the recent bullish impulse, 14-period ATR had declined toward approximately 1,700–1,800, close to the lower end of the volatility readings visible during this chart window.
During and after the impulse, ATR accelerated sharply toward approximately 2,600.
The sequence can therefore be described approximately as:
Compressed volatility → rapid directional displacement → concentrated participation → expanding volatility
That sequence strengthens the case that market behavior changed materially during the move.
But there is an important warning here.
Rising ATR is not bullish.
Falling ATR is not bearish.
ATR has no directional opinion. It measures volatility.
A violent collapse can produce exactly the same volatility expansion. Direction comes from price; ATR tells us about the changing scale of movement.
Three Questions for Every Completed Wave
At this point, the framework can remain surprisingly simple.
For every completed Zig Zag wave, ask three questions.
1. How big?
ATR-Normalized Magnitude = Absolute Price Change / Representative ATR
2. How fast?
Price Velocity = Absolute Price Change / Number of Bars
Preferably also calculate:
ATR-Normalized Velocity = Absolute Price Change / (Representative ATR x Number of Bars)
3. How much participation occurred per unit of time?
Volume Intensity = Total Wave Volume / Number of Bars
These measurements describe different dimensions of the same event.
Magnitude tells us how much the market repriced.
Velocity tells us how urgently it repriced.
Volume intensity tells us how much participation accompanied that repricing.
None should be interpreted completely independently.
Let the Market Tell Us What "Unusual" Means
We now face another question.
Suppose a wave measures eight ATR. Is that significant?
What about 1.2 ATR per day?
We could invent thresholds.
Perhaps anything above five ATR is "relevant." Perhaps anything below two ATR is "noise."
But why five?
Instead of imposing an arbitrary number, the instrument's own historical behavior can provide the benchmark.
Take all completed Zig Zag waves within a sufficiently representative historical sample and calculate, for each one:
Absolute displacement
ATR-normalized magnitude
Price velocity
ATR-normalized velocity
Volume intensity
Then determine where the current completed wave ranks within those distributions.
Suppose a wave produced hypothetical rankings of:
ATR-Normalized Magnitude: 85th percentile
ATR-Normalized Velocity: 95th percentile
Volume Intensity: 70th percentile
That would tell us the move was unusually large, exceptionally fast and accompanied by above-normal participation intensity relative to the chosen historical sample.
No arbitrary "five ATR rule" was necessary.
The market established its own reference distribution.
Compare the Wave Twice
There are actually two useful reference populations.
The primary population should contain all completed bullish and bearish Zig Zag waves.
For magnitude and velocity calculations, use absolute price movement while retaining direction as a separate characteristic.
This answers:
How unusual was this wave compared with market movements generally?
Then perform a secondary comparison against same-direction waves.
A bullish wave can be compared specifically with previous completed bullish waves, and a bearish wave with previous completed bearish waves.
That answers a different question:
How unusual was this bullish impulse compared with other bullish impulses?
Both perspectives contain useful information.
Using only same-direction waves immediately could hide information about the broader distribution of market movement. Using only the combined population could hide directional asymmetries.
Putting the Recent Wave Under the Microscope
Now return to the latest completed bullish Zig Zag wave on the chart.
Its approximate characteristics are:
Starting point: 62,520
Ending point: 79,625
Absolute displacement: +17,105
Duration: approximately 6 daily bars
Total wave volume: approximately 75.6K
Price velocity: approximately 2,851 points per day
Volume intensity: approximately 12.60K per day
A preliminary visual study of approximately 25 completed bullish and bearish waves visible on the supplied chart produced an approximate ranking against all visible completed waves of:
Absolute displacement: around the 76th percentile
Price velocity: around the 92nd percentile
Volume intensity: around the 84th percentile
Compared only with completed bullish waves visible in the same sample, absolute displacement appeared to rank around the 92nd percentile, while price velocity and volume intensity were near the upper end of the visible bullish-wave sample.
These numbers require a large warning label.
They were estimated from what we can see on the provided chart. Historical bar counts were not exported from TradingView, and exact ATR observations were not programmatically collected.
They are therefore illustrative estimates, not statistically precise backtest results.
A rigorous study should export the underlying data, identify exact pivot dates, count bars precisely and calculate ATR values programmatically.
Even with that limitation, the visible evidence provides a useful demonstration of the methodology.
The recent wave does not resemble an obvious low-information fluctuation.
A reasonable descriptive classification is:
High-intensity bullish impulse.
That description comes not from one isolated observation but from the interaction between relatively large displacement, unusually high velocity, concentrated volume participation and a transition from compressed toward expanding volatility.
What Might Have Contributed to the Repricing?
Price structure tells us what happened. Fundamentals may provide context for why market participants were suddenly willing to reprice the asset so aggressively.
As of August 21–22, 2026, contemporary reporting highlighted several potential contributors to the recent move.
U.S. spot Bitcoin products recorded approximately $1.6 billion of net inflows from Monday through Thursday, including roughly $606 million on Thursday alone. Other contemporary reporting pointed to changing Treasury-market expectations, a weaker U.S. dollar, renewed institutional demand and the covering of bearish positions as factors coinciding with the advance.
Those observations are context, not proof of causality.
Markets rarely provide the luxury of one clean explanation for a large move. ETF flows, liquidity conditions, positioning and macro expectations can interact, while some apparently important news may already be reflected in price.
For our purposes, the fundamental backdrop is secondary to an observable fact:
The market's behavior changed.
The quantitative framework attempts to measure the character of that change rather than assign a single narrative to it.
Low Total Volume Does Not Automatically Mean Noise
This deserves special emphasis.
Markets do not require extraordinary total volume to travel large distances.
Suppose sellers withdraw offers or opposing liquidity becomes scarce. A comparatively ordinary amount of aggressive buying may then move price much farther than it would in a deeper, more balanced market.
Consequently:
High price velocity + ordinary volume intensity
can still characterize a meaningful market event.
Possible explanations could include rapid repricing, a temporary liquidity vacuum, forced positioning or insufficient opposing liquidity.
Those are possible mechanisms, not conclusions we can prove from the chart alone.
Now consider the opposite case.
Suppose enormous volume accumulates over 30 days while price achieves very little net displacement.
That activity could reflect persistent two-sided trading, absorption or churn rather than efficient directional repricing.
This is why the question "How much volume?" is incomplete.
We also need to ask:
How much movement did that activity produce, and how long did it take?
Four Different Wave Personalities
Instead of immediately compressing everything into one "relevance score," it may be more informative to classify wave character.
For example:
High magnitude + high velocity + high volume intensity: strong directional impulse.
High magnitude + very high velocity + ordinary volume intensity: rapid repricing or possible liquidity-vacuum impulse.
Low velocity + high volume intensity + inefficient displacement: possible absorption, churn or two-sided battle.
Low magnitude + low velocity + low volume intensity: stronger candidate for ordinary market noise.
These are conceptual descriptions, not finalized trading rules.
The advantage is that they preserve information.
A single score might tell us that two waves both receive an "8." Yet one could have extraordinary velocity with moderate participation while the other could have extraordinary participation but modest velocity.
Those are not necessarily the same market events.
Relevant Does Not Mean Directionally Predictive
This may be the most important distinction in the entire framework.
Suppose our analysis concludes that a completed bullish wave is highly unusual.
What have we actually learned?
We have evidence that the movement was materially different from ordinary historical fluctuations.
We have not demonstrated that price must continue higher.
A highly relevant bullish impulse could subsequently:
Continue
Consolidate
Retrace
Reverse completely
"Relevant" therefore describes information content, not destiny.
The framework's first question is:
Was something unusual happening?
It is not:
What must happen next?
Keeping those questions separate prevents an analytical framework from quietly turning into an unsupported directional claim.
The Resistance Test
This distinction becomes especially important on the current chart.
Following the high-intensity bullish impulse, price may be on the way to reach a previously identified UnFilled Orders resistance area extending approximately from 81,210 to 84,945.
That creates an interesting forward-looking laboratory.
The bullish impulse tells us that the preceding repricing was unusually fast and intense.
The resistance area asks a new question:
How does the market respond when that impulse encounters potential opposing order flow?
A trader does not need to assume that resistance will hold.
Nor does the prior impulse justify assuming that resistance will break.
Instead, the next completed movement can itself be measured.
If a bearish response develops, compare its magnitude, velocity and volume intensity with those of the preceding bullish impulse.
A slow, low-intensity pullback would have a very different character from a bearish wave that matches or exceeds the bullish impulse across those dimensions.
That is where signal-versus-noise analysis can become more useful than simply labeling every red candle "bearish."
An Illustrative Forward-Looking Case Study
One possible hypothetical scenario is a rejection from the 81,210–84,945 resistance area.
For illustration, consider the following conditional structure only after price demonstrates rejection rather than assuming resistance will automatically hold:
Illustrative entry: 81,500
Protective stop: 85,000
Illustrative target: 74,500
Risk: 3,500 points
Potential reward: 7,000 points
Reward-to-risk ratio: 2.0 to 1
The purpose of these levels is to demonstrate risk construction, not to recommend a position.
The stop is positioned beyond the upper boundary of the identified resistance area rather than inside it. The target creates twice the price distance of the predefined risk.
Most importantly, the scenario is conditional.
A sustained acceptance above the resistance area would invalidate the underlying rejection thesis. Conversely, evidence of rejection would still not guarantee that the target is reached.
The preceding bullish wave was relevant. That does not make its next direction knowable.
A separate continuation case could eventually be studied if price establishes acceptance above resistance, but combining opposing setups before the market provides new evidence would dilute the educational purpose of this case study.
Risk Management Matters More Than the Label
Correctly identifying an unusual wave does not eliminate trading risk.
A trader could be entirely correct that a move is statistically exceptional and still be wrong about what happens next.
That is why risk should be defined before an illustrative entry is considered.
A simple position-sizing framework begins with:
Maximum Dollar Risk = Account Equity x Maximum Risk Percentage
Then:
Contracts = Maximum Dollar Risk / Dollar Risk Per Contract
The contract multiplier matters enormously.
For a 3,500-point stop, the theoretical price-distance exposure is very different between the standard and Micro contracts.
For BTC, where one contract represents 5 bitcoin:
3,500 x 5 = $17,500 of price-distance risk per contract
For MBT, where one contract represents 0.10 bitcoin:
3,500 x 0.10 = $350 of price-distance risk per contract
Those figures exclude commissions, fees, slippage and any gap-related execution differences.
This illustrates why contract specifications are part of risk management rather than administrative trivia.
Margin should also never be confused with maximum loss. Margin is the collateral requirement associated with maintaining a futures position. Market losses can exceed the margin deposited.
BTC and MBT Contract Specifications
BTC: 5 bitcoin per contract; minimum outright fluctuation of $5 per bitcoin, equal to $25 per contract.
MBT: 0.10 bitcoin per contract, or 1/50 the size of BTC; minimum outright fluctuation of $5 per bitcoin, equal to $0.50 per contract.
Settlement: Both contracts are financially settled using the CME CF Bitcoin Reference Rate.
Estimated margin: Approximately $85,000 for BTC and $1,700 for MBT. Margin requirements can change and may differ depending on the intermediary.
The important educational point is the scale difference.
The Micro contract represents 1/50 of the standard contract. Consequently, identical underlying price movements translate into very different dollar changes per contract. That distinction needs to be incorporated into position sizing and predefined risk calculations.
What This Framework Cannot Tell Us
No analytical framework should be presented without discussing its limits.
First, Zig Zag is inherently retrospective.
A pivot becomes confirmed only after sufficient reversal has occurred. Therefore, a completed historical Zig Zag wave contains information that an unfinished current leg does not yet possess.
Comparing an unfinished leg directly with confirmed historical waves can introduce a serious apples-to-oranges problem.
Second, ATR is not directional.
Volatility expansion tells us movement is becoming larger. It does not tell us whether bulls or bears are in control.
Third, CME Bitcoin futures volume represents activity in that futures market.
It should not be described as total global Bitcoin volume. Activity occurs across spot venues, derivatives exchanges and other instruments.
Fourth, historical percentiles depend on the chosen sample.
A 95th-percentile event over one year may rank very differently over five years.
Fifth, regimes change.
As market structure, volatility and participation evolve, a rolling historical reference population may eventually prove more informative than treating distant history and recent history equally.
Sixth, the percentile estimates used in this case study were visually approximated from the supplied screenshot.
They demonstrate the methodology. They do not constitute a statistically rigorous study.
Finally, statistical unusualness does not imply continuation.
A 99th-percentile bullish wave can still be followed by a bearish reversal.
The Next Research Question
Once completed waves can be characterized consistently, a more ambitious research question becomes possible.
Does the character of one completed wave contain useful information about the character of the next?
Suppose a high-intensity bullish impulse is followed by a bearish Zig Zag wave.
We could ask whether that bearish response exhibits:
Lower ATR-normalized magnitude
Lower price velocity
Lower ATR-normalized velocity
Lower volume intensity
If so, we might describe the bearish response as a relatively weak retracement.
Alternatively, if the bearish response equals or exceeds the bullish impulse across several dimensions, the market may be communicating something very different.
But that hypothesis requires a sufficiently large historical sample and proper testing.
It belongs to a second research layer.
The framework developed here is primarily about classification:
Signal or noise?
Only after classification has been studied rigorously should the analysis advance toward testing whether particular wave characteristics contain useful information about subsequent behavior.
Stop Asking Only How Far Price Moved
We began with a simple paradox.
One bullish wave accumulated approximately 266.31K of volume.
Another accumulated only 75.6K.
If total volume were our only yardstick, the first wave would appear overwhelmingly more significant.
Then we added time.
The earlier wave produced approximately 10.65K of volume per day.
The recent wave produced approximately 12.60K.
Then we measured price velocity.
The earlier wave traveled approximately 647 points per day.
The recent wave traveled approximately 2,851.
Suddenly, 75.6K did not look so small.
The broader lesson extends well beyond this particular chart.
A market move cannot be understood completely by asking only how far price traveled or how much volume accumulated.
Ask three questions:
How big was it relative to normal volatility?
How fast did it happen?
How concentrated was participation while it happened?
Magnitude describes how much the market repriced.
Velocity describes how urgently it repriced.
Volume intensity describes the participation accompanying that repricing.
Together, they provide a richer framework for distinguishing potentially meaningful market events from ordinary fluctuation.
They still cannot tell us the future.
And that may be precisely why the framework is useful: its purpose is not to manufacture certainty, but to measure the evidence already visible on the chart more intelligently.
Data Consideration
When charting futures, the data provided could be delayed. Traders working with the ticker symbols discussed in this idea may prefer to use CME Group real-time data plan on TradingView: www.tradingview.com - This consideration is particularly important for shorter-term traders, whereas it may be less critical for those focused on longer-term trading strategies.
General Disclaimer
The trade ideas presented herein are solely for illustrative purposes forming a part of a case study intended to demonstrate key principles in risk management within the context of the specific market scenarios discussed. These ideas are not to be interpreted as investment recommendations or financial advice. They do not endorse or promote any specific trading strategies, financial products, or services. The information provided is based on data believed to be reliable; however, its accuracy or completeness cannot be guaranteed. Trading in financial markets involves risks, including the potential loss of principal. Each individual should conduct their own research and consult with professional financial advisors before making any investment decisions. The author or publisher of this content bears no responsibility for any actions taken based on the information provided or for any resultant financial or other losses. Education 
GOLD - Local correction before growth ICMARKETS:XAUUSD is making new highs, but toward the end of Friday’s trading session, the market entered a local correction phase amid profit-taking. The market remains in a local bullish phase
The dollar is stagnating again after its sharp decline, with no change in market structure. Technically, the bearish move could continue
Gold is forming a correction within its bullish phase. The current liquidity-hunting phase could soon give way to another bullish impulse.
Next week, the main focus will be on the PCE data and GDP.
Technically, gold is forming a bottom around 4,000 and breaking its local market structure, suggesting a potential return to the broader trend. At the open of the session, gold could continue its local correction before resuming the uptrend.
Areas of interest: 4,770–4,860
Resistance levels: 4630, 4650
Support levels: 4590, 4578, 4563
Locally, the key range is 4,563–4,630. Within the current range, gold is correcting toward the liquidity zone.
A long squeeze around the 4,590–4,580 area could trigger a bounce and a move higher toward 4,650
Best regards,
R. Linda Long 
BITCOIN - Correction before a rally to 83000BINANCE:BTCUSDT.P , amid the current market euphoria and a shift from consolidation to distribution, is testing the 80K resistance area. Locally, there are bullish conditions, but strong resistance lies ahead
The market entered a rally phase following the crypto summit held at the White House. Is Trump once again engaging in pre-election manipulation???
Technically, Bitcoin is breaking out of its year-long bearish trend, with news acting as the main catalyst for the move.
The 67,200–60,000 consolidation phase is coming to an end with relatively strong distribution, while price is heading toward 82,900.
Locally, after the strong rally, Bitcoin has entered a 76K–79.5K consolidation phase. Within the local bullish trend, the market could retest the 76,400–75,700 support zone.
A long squeeze around the support zone could shift the balance of power in favor of buyers, potentially triggering a move toward 82,500
Resistance levels: 79550, 82460
Support levels: 76390, 75770, 73450
A long squeeze of the support zone, followed by a return into the range and consolidation above the key level, could become a technical catalyst for further upside under the current market conditions
Best regards,
R. Linda Long 
 Long
Long
GOLD - The Hunt for Liquidity Ahead of the Rally ICMARKETS:XAUUSD , within a news-driven distribution phase, is testing the 4,525 D1 level and is bouncing back toward support in search of liquidity
The Dollar Index continues to decline sharply, providing support for gold. However, caution is warranted given the current fundamental and geopolitical backdrop.
Gold’s bullish bias should remain intact unless we see a sharp rise in oil prices or a hawkish shift from the Fed.
The nearest areas of interest and liquidity are 4,480 (4,472)–4,450
Drivers:
Downside: hawkish Fed signals, conflict escalation (which could support the dollar), higher oil prices.
Upside: weaker dollar, lower yields, dip-buying
Resistance levels: 4525, 4541, 4580
Support levels: 4472, 4450, 4435
Technically, before continuing higher toward 4,540–4,580, gold could form a correction toward 4,472–4,450–4,435, targeting liquidity below the current price.
A long squeeze could shift the local balance of power in favor of buyers and trigger further upside
Best regards,
R. Linda Long 
DXY Daily — X-Wave or the Beginning of a Larger Decline?The U.S. Dollar Index has been developing a complex corrective structure since the September 28, 2022 peak.
From a broader market perspective, the current price action is important because the next structural development in DXY could have meaningful implications across global markets.
A stronger decline in the dollar could potentially support strength in equities, commodities, precious metals, energy markets, cryptocurrencies, and major FX pairs trading against the U.S. dollar.
However, the current structure does not yet provide enough evidence to confirm that a major new bearish cycle has already begun.
Beginning of the Analysis
Beginning: Wed, Sep 28, 2022
Beginning Price: $114.723
From this peak, DXY began developing a bearish structure.
From an Elliott Wave perspective, we can identify two impulsive movements within Waves A and C, connected by a corrective Wave B.
Together, they form a Simple Zigzag:
Impulse A + Corrective B + Impulse C = Zigzag (W)
After the completion of Wave (W), the market entered Wave (X).
Aggressive Scenario — Current Primary Count
The current structure still has the characteristics of a corrective three-wave movement.
For that reason, these three waves alone are not enough to confirm the beginning of a major new bearish trend in DXY.
In a Double Zigzag, Wave X is normally corrective and can terminate near the area of Wave B from the previous Zigzag.
However, the current correction is still relatively small.
It may continue to develop in terms of time, price depth, or structural complexity before Wave X is complete.
Therefore, Wave (X) could:
• Remain a relatively simple correction.
• Expand further in both price and time.
• Develop into a Double Zigzag.
• Or potentially become an even more complex structure, such as a Triple Zigzag.
If this scenario remains valid, another bearish leg could develop after Wave (X) is completed.
The larger structure could therefore develop as:
(W) – (X) – (Y)
This means the current decline should not yet be interpreted as a confirmed straight-line collapse in the U.S. Dollar.
Instead, what we are seeing may simply be the corrective X-Wave between two larger bearish legs.
Conservative Scenario — An Early Larger Turn
The weekly analysis continues to consider the possibility of an extended bullish market structure.
However, the daily chart presents another important structural possibility.
DXY could potentially enter a much larger bearish cycle earlier than expected.
The key feature of this scenario is the possibility of two nested structures:
1–2 & 1–2
If these two structures eventually become confirmed as being of comparable degree and proportion, the decline that began from the September 28, 2022 peak could represent part of a much larger Zigzag.
Under this interpretation, the market could currently be developing Wave A of that larger structure.
The nested 1–2 structures would then provide the setup for a potentially much stronger Third Wave.
If this scenario is confirmed by price action, a significant decline in DXY could potentially create additional momentum across markets that typically have an inverse relationship with the U.S. dollar.
That could include:
Equities — Commodities — Oil & Energy — Gold & Silver — Cryptocurrencies — Major FX Pairs
Still, this remains a structural scenario, not a prediction or certainty.
The market itself must confirm or invalidate the count through future price development.
Why Is This Called the Conservative Scenario?
Being “conservative” does not necessarily mean expecting a smaller move or a less aggressive market outcome.
At different wave degrees, the conservative interpretation can be completely different.
The conservative approach here is based on the classical principles of the Elliott Wave Principle.
After an impulsive movement, we should expect a corrective structure that is proportionate to the previous movement.
Rather than forcing the market into a predetermined forecast, we continue to examine the lower-degree structures and allow the actual price development to reveal which scenario has greater structural validity.
Current Conclusion
For now, the Aggressive Scenario remains the primary focus.
The current three-wave structure is likely still corrective, and Wave (X) may continue to develop in terms of time, depth, and complexity.
If Wave (X) eventually completes, the larger structure could continue developing as:
(W) – (X) – (Y)
At the same time, we need to keep monitoring the possibility of an early larger bearish turn, particularly if the nested:
1–2 & 1–2
structures become confirmed.
Such confirmation could signal the beginning of a much more powerful bearish phase in DXY, with potentially broader consequences across markets that are sensitive to dollar strength.
Ultimately, it is the structure that price develops from the current area that will determine whether this move is simply an X-Wave within a Double Zigzag, or the early stages of a much larger bearish cycle.
Mr. Nobody Elliott Wave Principle
U.S. Dollar Currency Index
Jun 5
The DXY Time Paradox: Monday Engineering & Elliott Wave Dissecti
 Short
Short
HYPEUSDT - A Pullback Before a Bull Run BINANCE:HYPEUSDT.P is forming a local bullish setup. The altcoin is outperforming the broader market, including Bitcoin, and for this reason, the coin has further upside potential
Bitcoin, meanwhile, remains neutral within a consolidation that has been developing for several months as part of the broader global bearish market.
HYPE maintains its global bullish trend, within which a 53.0–75.0 trading range is forming. The range is relatively wide, and the bounce from support opens up a medium-term trading opportunity. There is still room for further upside, and we are waiting for the bulls to step in more aggressively
Resistance levels: 60.47, 63.0
Support levels: 58.0, 57.09
The market is confirming its local bullish structure. However, after reaching a new high, a counter-trend correction is developing toward the imbalance zone.
An upside breakout followed by consolidation above 58.0 could provide the catalyst for the continuation of the uptrend toward 60–63
Best regards,
R. Linda Long 
GOLD - The Hunt for Liquidity Ahead of the Distribution ICMARKETS:XAUUSD maintains its local bullish trend and is entering a consolidation phase, within which a clear trigger is forming. A breakout of this trigger could strengthen the continuation of the upward move
The Dollar Index remains stagnant and is testing support within a downward impulse. Further dollar weakness could become a technical driver for gold upside. The key area to watch is 4,390–4,370.
The correction in gold appears temporary. The fundamental backdrop — including a weaker dollar and expectations of lower Fed rates — continues to support the metal. Key events this week include the FOMC minutes on Wednesday, as well as U.S. housing and industrial production data.
Technically, dip-buying remains the more likely scenario.
Drivers:
Downside: higher oil prices and yields, stronger dollar, geopolitical uncertainty.
Upside: weaker dollar, lower rate expectations, dip-buying
Resistance levels: 4,435, 4,450, 4,500
Support levels: 4,388, 4,371, 4,313
Gold maintains its local bullish trend. The market is confirming resistance at 4,435, but is forming a correction ahead of a potential breakout, with a possible liquidity hunt as the objective.
A bounce from the 4,370–4,388 zone could trigger a breakout above 4,435 and open the way for further upside toward 4,480–4,500
Best regards,
R. Linda Long 
GOLD - The local uptrend continuesFX:XAUUSD is bouncing off the 4,313 support level of the trading range formed within the local bullish trend. The situation remains challenging, but the market still has room for further upside
The dollar remains stagnant but continues to look weak. A decline in the Dollar Index could support further upside and the ongoing local bullish trend in gold.
The fundamental and geopolitical backdrop remains unstable.
Globally, gold remains in a bearish trend.
Locally, the market is in a bullish distribution phase, with a 4,313–4,435 range forming within it.
Gold is currently correcting within the range ahead of a potential move higher.
There are not many major events scheduled for the coming week. Attention will be focused on the FOMC meeting, initial jobless claims, and PMI data
Resistance level: 4,435
Support levels: 4,356, 4,313
A long squeeze around the local 4,356 support zone could shift the balance of power in favor of buyers and trigger a continuation of the local uptrend toward the upper boundary of the trading range
Best regards,
R. Linda Long 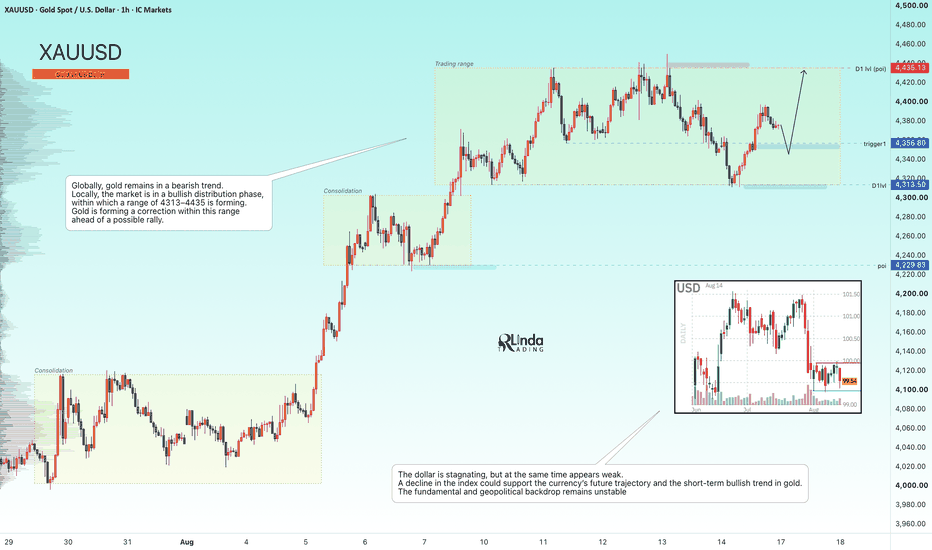
ETHUSDT - Consolidation Before Distribution BINANCE:ETHUSDT is attempting to hold above the 1,850 support level in the medium term, which was previously broken resistance. The reaction to support is weakening, while the broader market remains in a bearish trend
Bitcoin remains stagnant and range-bound. Globally, the market remains in a bearish trend, with no fundamental support in sight.
A decline in the market leader could trigger further downside in Ethereum. The altcoin is consolidating within a symmetrical triangle. The market is building a pre-breakdown base near the lower boundary of the current range, suggesting that a downside breakout may be approaching
Resistance levels: 1,989, 1,927
Support levels: 1,866, 1,854, 1,820
The weak reaction to support indicates that selling pressure may be intensifying. I do not rule out a local liquidity sweep (short squeeze) before the downtrend resumes.
A close below the 1,866–1,854 zone could accelerate the further decline
Best regards,
R. Linda Short 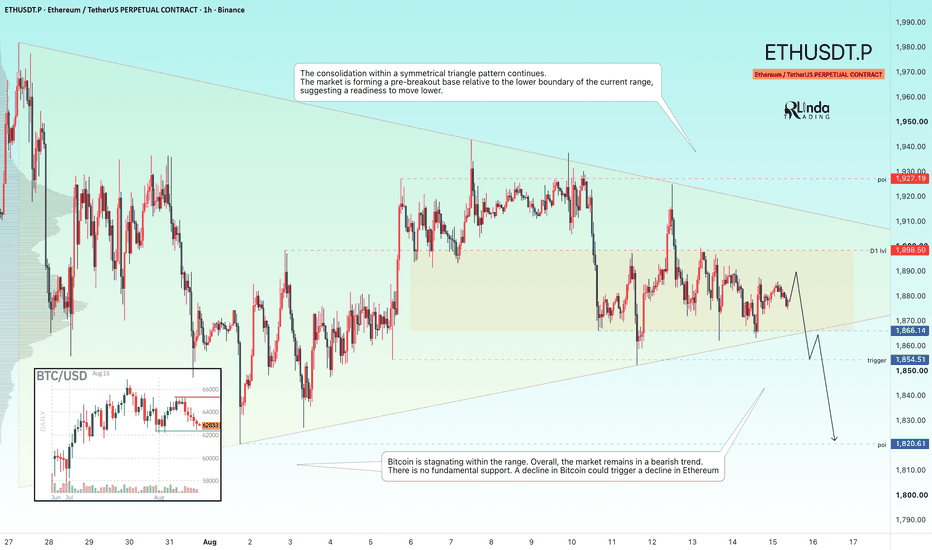
GOLD - The Hunt for Liquidity Ahead of a Rally ICMARKETS:XAUUSD is testing the 4,313 support level as part of a correction. Against the backdrop of a stagnant Dollar Index, the market still has room for further upside
The Dollar Index remains stagnant, but an unstable fundamental and geopolitical backdrop is putting pressure on the dollar and providing support for gold.
Price is correcting after the recent rally, but the fundamental backdrop — including easing rate expectations and geopolitical risks — remains favorable. Buyers are expected to step in on dips.
The key event will be the University of Michigan’s consumer sentiment and inflation expectations data, due later on Friday.
Drivers:
Downside: conflict escalation, rising yields, stronger dollar.
Upside: dip-buying, weaker dollar, easing geopolitical risks
Resistance levels: 4,356, 4,435
Support levels: 4,313, 4,300
Gold maintains its local bullish trend. Within the counter-trend correction, the market is retesting the key liquidity zone at 4,313–4,300 and is bouncing off support.
A close above 4,356 could strengthen the bullish momentum
Best regards,
R. Linda Long 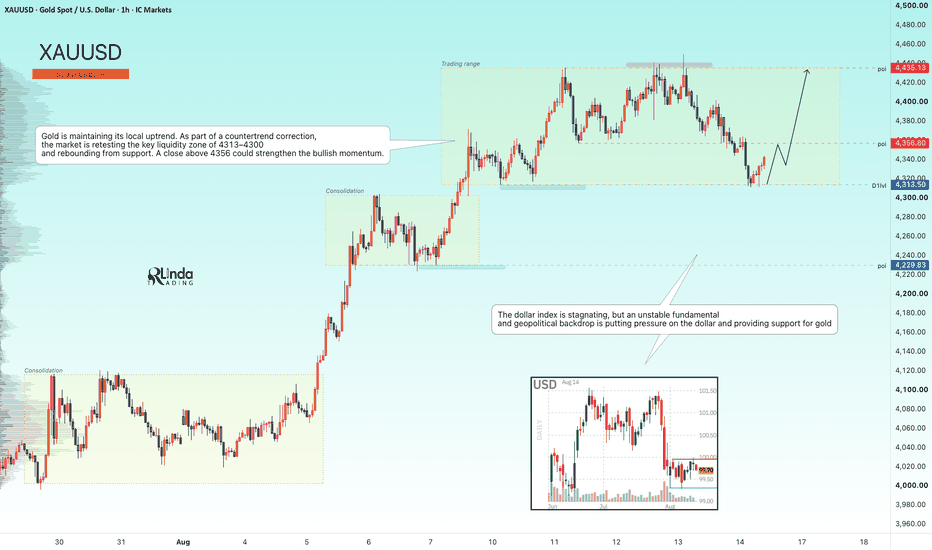
BITCOIN - A false breakout before a declineBINANCE:BTCUSDT.P closed within the 62,000–66,000 range. Liquidity zones have formed around the consolidation boundaries, but buyer weakness could potentially trigger a decline toward the areas of interest
There is no fundamental support in the market, while the geopolitical backdrop is exerting excessive pressure.
Technically, Bitcoin remains stagnant and trapped inside a sideways range that is developing within the broader global bearish trend. Simply put, the market is consolidating.
The reaction to support is weakening. However, before the decline continues, market makers may trigger a short squeeze toward the 65K resistance level. The area of interest is the liquidity zone around 62,300
Resistance levels: 64,500, 65,400
Support levels: 62,300, 61,900
A false breakout of the nearest resistance zone could shift the balance of power in favor of sellers and trigger a breakout from the triangle, potentially followed by downward distribution toward 62,000
Best regards,
R. Linda Short 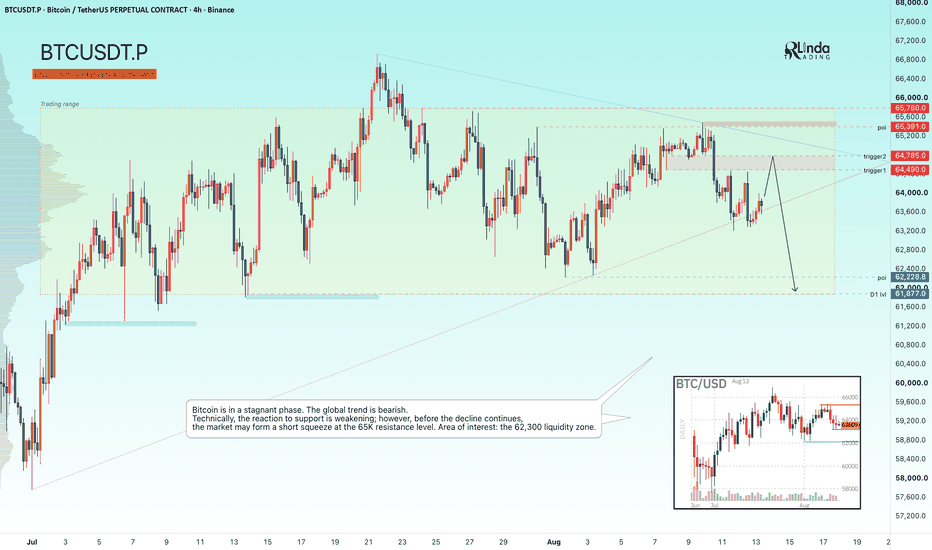
Natural Gas: Buyers are pressing the Wedge top again📊 Natural Gas: Buyers are pressing the Wedge top again
Natural Gas is pushing back toward the upper boundary of the rising wedge, with price trading near 2.84-2.85 after holding the lower trendline.
The structure is still constructive: price remains above EMA9, EMA20 and SMA50, while the 200 SMA is lower near 2.75. Buyers are still in control of the short-term trend, but price is now approaching a difficult resistance zone.
The Zig Zag structure also supports the idea of higher swing lows. After the move from 2.6377, Natural Gas printed a higher swing around 2.8222, and now price is trying to push toward the next swing zone near 2.8695. This shows that the market is still building upward structure, but it is also getting close to the wedge top.
The key resistance is 2.86-2.87. This is where the previous rejection happened, and it also matches the upper wedge boundary.
RSI is around 62, so momentum is positive but not extremely overheated. MACD is turning higher again, which supports the breakout attempt, but confirmation is still needed.
If Natural Gas breaks and holds above 2.87, the next upside target is 2.90, then potentially 2.95.
If price rejects again from 2.86-2.87, the first pullback zone is 2.82-2.81. A break below 2.81 would weaken the wedge and open a deeper move toward 2.78, then 2.75.
⚠️ Not financial advice. GOLD - The news could trigger a long squeezeICMARKETS:XAUUSD is consolidating within the 4355–4435 range, while the U.S. dollar remains largely stagnant ahead of the upcoming CPI data. Until the release, the market may remain trapped inside the current range while preparing for a potential liquidity manipulation
The U.S. Dollar Index is also consolidating as traders wait for the CPI report. Gold has stalled ahead of this key inflation data, and the initial reaction to CPI could be short-lived as geopolitical risks remain elevated.
A weaker-than-expected CPI could open the door to new highs, while hotter inflation data could trigger a corrective move. The market is waiting for a clear catalyst.
Bullish drivers: Weaker CPI, A weaker U.S. dollar, Lower expectations for further rate hikes, Geopolitical de-escalation
Bearish drivers: Hotter-than-expected CPI, Hawkish Fed rhetoric, A stronger U.S. dollar, Geopolitical escalation
Gold remains in a bullish phase, but news-driven volatility could create a liquidity sweep / long squeeze before the next directional move
Resistance levels: 4435, 4481
Support levels: 4356, 4313, 4302
Gold remains in a bullish phase. However, news-driven volatility could create a liquidity sweep / long squeeze before the next continuation move.
The key zones to watch are 4350 and 4313. A false breakdown of either level, followed by consolidation back above it, could become the technical catalyst for another bullish impulse.
Best regards,
R. Linda Long 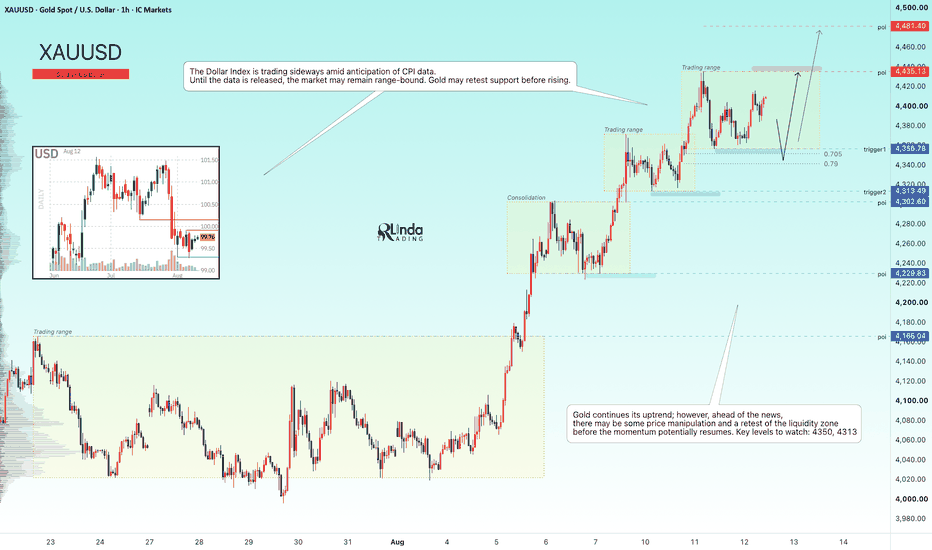
 Short
Short
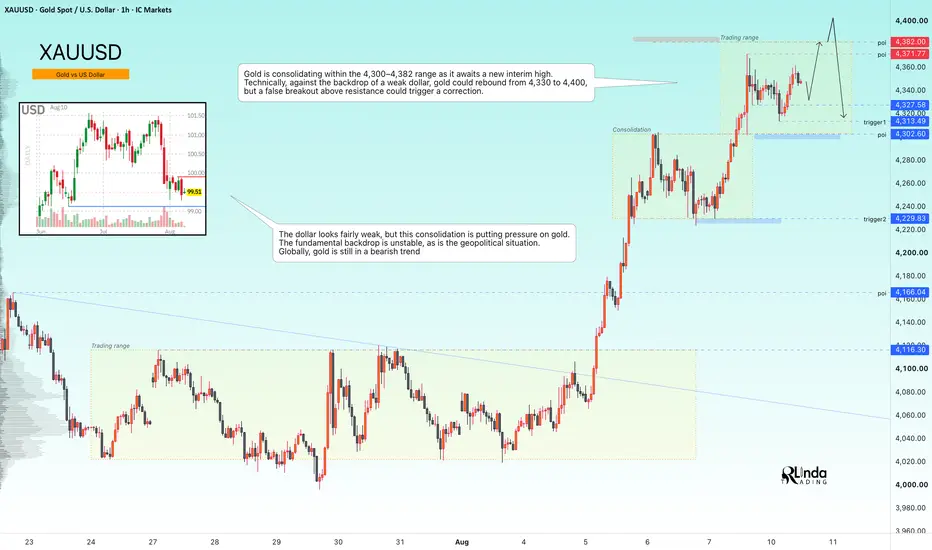
GOLD - Retest of 4400. Waiting for a false breakout ICMARKETS:XAUUSD is showing local bullish momentum, but price is approaching a major resistance zone at 4382–4400. At the same time, the U.S. dollar remains weak, although its current consolidation continues to create pressure across the markets
The fundamental backdrop remains unstable. Geopolitical risks continue to support the dollar, while expectations for further Fed rate hikes have weakened. Against this mixed backdrop, gold remains within a broader bearish trend.
Gold is consolidating inside the 4300–4382 range while preparing for a potential retest of the recent high. Technically, continued dollar weakness could allow gold to rebound from 4330 toward 4400. However, profit-taking around 4380–4400, followed by a false breakout, could trigger a reversal.
Bullish drivers: Weaker-than-expected inflation data, Continued U.S. dollar weakness, Lower rate expectations
Bearish drivers: U.S. dollar strengthening, Rising oil prices and inflation expectations, Profit-taking ahead of the CPI report
Resistance levels: 4371, 4382, 4400
Support levels: 4327, 4313, 4302
A short squeeze through the resistance zone followed by a bearish reversal pattern could trigger a pullback or even reverse the current local bullish momentum.
However, an unexpected fundamental catalyst or a sustained close above 4400 could invalidate the bearish setup and open the way toward 4450–4475.
Best regards,
R. Linda Short