Harmonic Envelope Oscillator 1.1
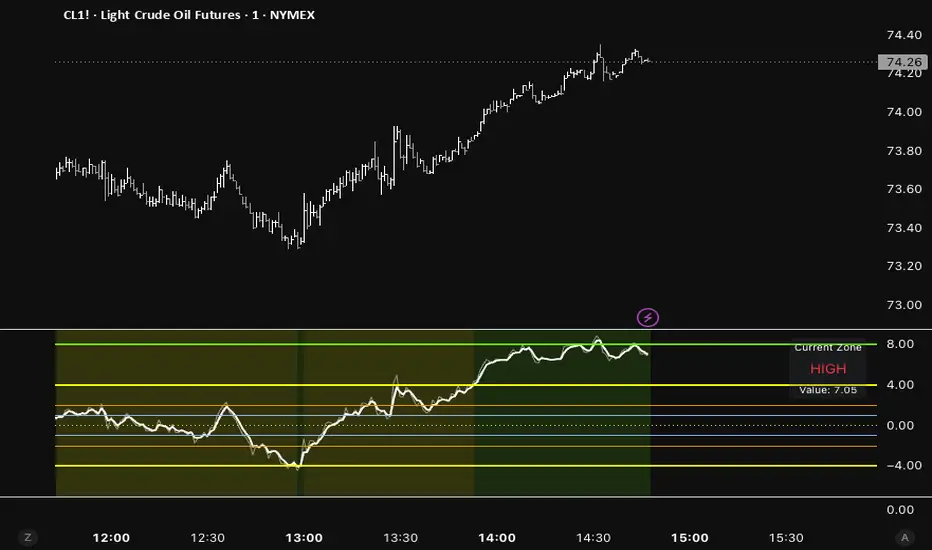
Harmonic Envelope Oscillator 1.1 (HE Oscillator) is a non-overlay momentum oscillator that measures how far price has deviated from a central moving average, normalized into clean harmonic levels based on powers of 2.It calculates multiple SMAs with exponentially increasing lengths (base length × 1, 2, 4, 8, ..., 128), uses one of them as the dynamic center (default MA3), and then normalizes the deviation using a highly flexible multiplier (from 1/1024 up to 16384 with fine-tuning). The result is plotted as a smooth oscillator with fixed harmonic envelopes at ±1, ±2, ±4, ±8, ±16, ±32, ±64, ±128.The indicator features clear color-coded zones, background coloring, a real-time "Current Zone" table, and zero-line cross signals.Main Use Cases:1. Mean-Reversion TradingExtreme readings (Env 4 / +8 and above) often mark overextended conditions and potential reversal zones.
Especially powerful when price reaches "Unicorn" or "Env 8" levels.
2. Trend Strength & Momentum ConfirmationSustained readings above +4 or +8 confirm strong directional moves.
Helps you stay in trending trades longer and avoid premature exits.
3. Volatility & Regime IdentificationThe colored zones visually tell you the current market character:Noise / Continuation → low volatility, chop
High / Very High → strong momentum
Extreme → Unicorn → Env 8 → outlier / parabolic moves
4. Scalping & IntradayUse tighter multipliers (1/4 to 1/2) on 1m–15m charts for precise entries around zero and Env 1–2 levels.
5. Swing & Position TradingHigher multipliers (1 to 16+) on 1H–Daily charts work well to spot major exhaustion points.
6. Divergence & Confluence ToolExcellent when combined with other indicators (RSI, MACD, Volume Profile, or the Gann Grid you asked about earlier) for high-probability setups.
Strengths: Very clean and structured harmonic levels (mathematically elegant).
Adaptive to different instruments and timeframes via the multiplier.
Excellent visual hierarchy with zones and table.
Especially powerful when price reaches "Unicorn" or "Env 8" levels.
2. Trend Strength & Momentum ConfirmationSustained readings above +4 or +8 confirm strong directional moves.
Helps you stay in trending trades longer and avoid premature exits.
3. Volatility & Regime IdentificationThe colored zones visually tell you the current market character:Noise / Continuation → low volatility, chop
High / Very High → strong momentum
Extreme → Unicorn → Env 8 → outlier / parabolic moves
4. Scalping & IntradayUse tighter multipliers (1/4 to 1/2) on 1m–15m charts for precise entries around zero and Env 1–2 levels.
5. Swing & Position TradingHigher multipliers (1 to 16+) on 1H–Daily charts work well to spot major exhaustion points.
6. Divergence & Confluence ToolExcellent when combined with other indicators (RSI, MACD, Volume Profile, or the Gann Grid you asked about earlier) for high-probability setups.
Strengths: Very clean and structured harmonic levels (mathematically elegant).
Adaptive to different instruments and timeframes via the multiplier.
Excellent visual hierarchy with zones and table.

Отказ от ответственности
Информация и публикации не предназначены для предоставления и не являются финансовыми, инвестиционными, торговыми или другими видами советов или рекомендаций, предоставленных или одобренных TradingView. Подробнее читайте в Условиях использования.
Отказ от ответственности
Информация и публикации не предназначены для предоставления и не являются финансовыми, инвестиционными, торговыми или другими видами советов или рекомендаций, предоставленных или одобренных TradingView. Подробнее читайте в Условиях использования.