Обновлено
Trend & Range Analysis (Zeiierman)
█ Overview
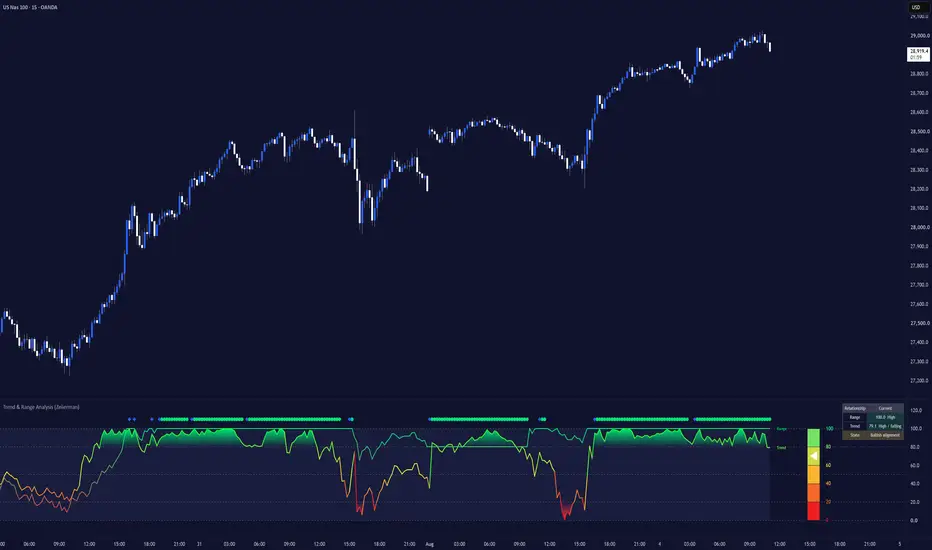
Trend & Range Analysis (Zeiierman) is a multi-layer market analysis system designed to visualize trend direction, range positioning, trend strength, and changing market conditions from a single oscillator panel.

The indicator combines two complementary market views: one focused on directional trend behavior and another focused on where price is positioned within its broader trading structure. Together, they help identify trending conditions, momentum expansion, pullbacks, and periods where the market begins shifting from one state into another.

█ Why This One Is Unique
Instead of relying on a single oscillator or one directional reading, the system continuously compares multiple layers of market behavior and evaluates how they interact with each other.
This creates a more complete view of current conditions, allowing traders to see not only direction, but also trend strength, internal alignment, developing disagreement, and potential pullback conditions.
By combining these different views into one framework, the indicator can provide more context around whether a move is strengthening, losing consistency, entering a temporary counter-move, or beginning to realign with the prevailing trend.
█ Main Features
⚪ Trend Analysis Oscillator
Measures the underlying price trend through an adaptive trend model, helping identify directional bias, trend persistence, and changes in momentum as market conditions evolve. Its adaptive behavior helps maintain a more consistent trend reading across both faster and slower market environments.

⚪ Range Trend Oscillator
Measures the market’s current directional condition through a second trend model, helping identify sustained pressure, developing shifts, and periods where trend conditions are strengthening or weakening. It adds another layer of confirmation to the main price trend and helps show whether the broader market structure remains bullish, bearish, or starts losing direction.

⚪ Complete Oscillator
Features such as Trend & Impulse Bars, Strong Trend Signals, the Trend Strength Ladder, and the Relationship Table are designed to help traders align trades with stronger trends while also identifying potential pullbacks within those trends.
Instead of relying on one single reading, the complete oscillator combines the Trend and Range components to give a clearer view of market direction, trend strength, and situations where the shorter-term price trend temporarily moves against the broader structure.

█ How to Use
⚪ Trend Trading
When the Price Trend Oscillator and the Range Trend Oscillator move together and show strong alignment, this can be considered a stronger directional move because both the price trend and the broader trading structure agree on the same direction.
For example, when both oscillators are moving higher and remain in bullish territory, the market is showing stronger bullish alignment. The opposite applies when both oscillators are moving lower and remain in bearish territory.
When the Strong Trend Signals appear above or below the oscillator, it is a sign that the market has entered a stronger trend state. This can lead to continued movement in the current direction, but it can also appear around larger trend transitions, so it should be used together with the oscillator structure rather than as a standalone signal.

⚪ Pullback Trading
In simple terms, when the Range structure is bullish, values above approximately 60 can be considered a stronger bullish condition.
If, at the same time, the Price Trend Oscillator becomes temporarily oversold or drops below 50, we may have a situation where price is experiencing a short-term pullback while the broader bullish structure is still intact.
This combination can help identify potential pullback areas for long trades: the broader market structure remains bullish, while the shorter-term price trend temporarily moves against it.
The idea is not simply to buy because the Trend Oscillator is low. The important part is that the Range structure remains bullish while the shorter-term Trend Oscillator becomes temporarily weak.

The same logic applies to short trades.
If the overall Range structure is bearish, with values below approximately 40, while the Price Trend Oscillator becomes temporarily overbought or moves above 50, this can show a temporary bullish pullback inside a broader bearish structure.
This combination can help identify potential pullback areas for short trades when the temporary counter-move begins losing strength.

⚪ Relationship Table
To make it easier for traders to identify pullbacks within stronger trends, the Relationship Table provides a simplified reading of how the Trend and Range oscillators are currently interacting.
Instead of manually comparing both oscillators on every bar, the table can help highlight when a bullish or bearish pullback condition is developing and whether both components are currently aligned or moving out of sync.

⚪ Trend Strength for Confluence
The Trend Strength Ladder provides a quick view of how strongly the indicator’s internal components agree.
Higher agreement can support stronger directional conviction, while weaker readings can highlight mixed conditions or increasing conflict between the underlying trend signals.
Values around the middle area, approximately 40–60, can indicate that the internal trend structure is less decisive. This can happen during consolidation, pullbacks, or when the market is beginning to transition from one trend condition into another.
For this reason, the Trend Strength Ladder is best used as confluence together with the Trend and Range oscillators rather than as a standalone entry signal.
Bullish Example

Bearish Example

⚪ Trend Candles
One way to use the Trend Candles is as a higher-timeframe trend filter.
For example, turn on the Trend Candles on a higher timeframe such as the 1-hour or 15-minute chart and increase the Significance value to above approximately 230. This creates a slower and more selective reading that can help highlight longer-term strong trend conditions.
You can then split your screen and monitor a lower timeframe, such as the 5-minute chart, to look for bullish or bearish pullbacks that align with the stronger higher-timeframe Trend Candles.
For example, if the higher timeframe continues showing a strong bullish trend, the lower timeframe can be used to identify temporary bearish pullbacks and potential areas where the larger bullish move may resume. The same approach can be reversed during stronger bearish trends.

█ How It Works
⚪ Dual-Phase Quant Model
The indicator processes market behavior through two independently evolving analytical phases. Each phase is normalized into a comparable state space, allowing directional pressure, persistence, and behavioral shifts to be evaluated on a common scale.
⚪ Phase Differential Engine
The system continuously measures the relative displacement between both phases and evaluates how that relationship changes over time.
Phase distance, directional agreement, persistence, and transition velocity are combined into an internal coherence model designed to distinguish synchronized conditions from temporary dislocations and developing regime shifts.
⚪ Pullback State Model
Pullback conditions are identified through a multi-factor state assessment that evaluates phase separation, directional persistence, relative positioning, and recovery behavior. Instead of reacting to a single threshold event, the model tracks whether the internal imbalance is strengthening, stabilizing, degrading, or beginning to normalize.
⚪ Composite Trend Strength
The indicator combines normalized phase agreement, directional consistency, momentum persistence, and internal coherence into a composite strength framework.
The resulting score is dynamically scaled to represent the degree of alignment between the system’s internal states, providing a simplified view of conviction, transition, and structural conflict.
-----------------
Disclaimer
The content provided in my scripts, indicators, ideas, algorithms, and systems is for educational and informational purposes only. It does not constitute financial advice, investment recommendations, or a solicitation to buy or sell any financial instruments. I will not accept liability for any loss or damage, including without limitation any loss of profit, which may arise directly or indirectly from the use of or reliance on such information.
All investments involve risk, and the past performance of a security, industry, sector, market, financial product, trading strategy, backtest, or individual's trading does not guarantee future results or returns. Investors are fully responsible for any investment decisions they make. Such decisions should be based solely on an evaluation of their financial circumstances, investment objectives, risk tolerance, and liquidity needs.
Trend & Range Analysis (Zeiierman) is a multi-layer market analysis system designed to visualize trend direction, range positioning, trend strength, and changing market conditions from a single oscillator panel.
The indicator combines two complementary market views: one focused on directional trend behavior and another focused on where price is positioned within its broader trading structure. Together, they help identify trending conditions, momentum expansion, pullbacks, and periods where the market begins shifting from one state into another.
█ Why This One Is Unique
Instead of relying on a single oscillator or one directional reading, the system continuously compares multiple layers of market behavior and evaluates how they interact with each other.
This creates a more complete view of current conditions, allowing traders to see not only direction, but also trend strength, internal alignment, developing disagreement, and potential pullback conditions.
By combining these different views into one framework, the indicator can provide more context around whether a move is strengthening, losing consistency, entering a temporary counter-move, or beginning to realign with the prevailing trend.
█ Main Features
⚪ Trend Analysis Oscillator
Measures the underlying price trend through an adaptive trend model, helping identify directional bias, trend persistence, and changes in momentum as market conditions evolve. Its adaptive behavior helps maintain a more consistent trend reading across both faster and slower market environments.
⚪ Range Trend Oscillator
Measures the market’s current directional condition through a second trend model, helping identify sustained pressure, developing shifts, and periods where trend conditions are strengthening or weakening. It adds another layer of confirmation to the main price trend and helps show whether the broader market structure remains bullish, bearish, or starts losing direction.
⚪ Complete Oscillator
Features such as Trend & Impulse Bars, Strong Trend Signals, the Trend Strength Ladder, and the Relationship Table are designed to help traders align trades with stronger trends while also identifying potential pullbacks within those trends.
Instead of relying on one single reading, the complete oscillator combines the Trend and Range components to give a clearer view of market direction, trend strength, and situations where the shorter-term price trend temporarily moves against the broader structure.
⚪ Relationship Table
Analyzes how the Trend and Range components behave in relation to each other, helping identify alignment, separation, and developing shifts in market behavior. This makes it easier to recognize when both models support the same directional view or when they begin moving out of sync.
The table can also help simplify the pullback analysis by displaying whether the current relationship between both oscillators is more bullish, bearish, or mixed.
⚪ Pullback States
Monitors the relationship between both trend models to identify developing bullish and bearish pullback conditions. It helps highlight situations where a temporary counter-move may be losing strength while the broader directional trend remains intact and may be preparing to continue.
The main idea is to separate a temporary pullback from a complete change in market structure.
⚪ Trend Strength Ladder
Measures how strongly the indicator’s internal trend models agree and converts that information into a simplified strength reading. This helps identify strong directional conditions, mixed environments, and periods where internal trend conviction is weakening.
Higher agreement generally means the Trend and Range components are supporting each other, while lower agreement can show increasing conflict between the two.
⚪ Strong Trend Signals
Identifies periods where directional pressure develops into a stronger and more persistent trend condition. The signals help highlight both the start of a stronger move and the continuation of that trend state.
These signals can be useful as additional confirmation when the Trend and Range oscillators are already showing alignment.
⚪ Trend & Impulse Bars
Analyzes price behavior for periods of increased directional significance and highlights them directly on the chart.
Trend Mode provides a more stable view of sustained movement and is designed to react less to smaller short-term fluctuations.
Impulse Mode reacts faster and can highlight shorter-term changes in directional pressure.
The bars can be used as an additional visual confirmation of when price itself is showing stronger directional behavior.
█ How to Use
⚪ Trend Trading
When the Price Trend Oscillator and the Range Trend Oscillator move together and show strong alignment, this can be considered a stronger directional move because both the price trend and the broader trading structure agree on the same direction.
For example, when both oscillators are moving higher and remain in bullish territory, the market is showing stronger bullish alignment. The opposite applies when both oscillators are moving lower and remain in bearish territory.
When the Strong Trend Signals appear above or below the oscillator, it is a sign that the market has entered a stronger trend state. This can lead to continued movement in the current direction, but it can also appear around larger trend transitions, so it should be used together with the oscillator structure rather than as a standalone signal.
⚪ Pullback Trading
In simple terms, when the Range structure is bullish, values above approximately 60 can be considered a stronger bullish condition.
If, at the same time, the Price Trend Oscillator becomes temporarily oversold or drops below 50, we may have a situation where price is experiencing a short-term pullback while the broader bullish structure is still intact.
This combination can help identify potential pullback areas for long trades: the broader market structure remains bullish, while the shorter-term price trend temporarily moves against it.
The idea is not simply to buy because the Trend Oscillator is low. The important part is that the Range structure remains bullish while the shorter-term Trend Oscillator becomes temporarily weak.
The same logic applies to short trades.
If the overall Range structure is bearish, with values below approximately 40, while the Price Trend Oscillator becomes temporarily overbought or moves above 50, this can show a temporary bullish pullback inside a broader bearish structure.
This combination can help identify potential pullback areas for short trades when the temporary counter-move begins losing strength.
⚪ Relationship Table
To make it easier for traders to identify pullbacks within stronger trends, the Relationship Table provides a simplified reading of how the Trend and Range oscillators are currently interacting.
Instead of manually comparing both oscillators on every bar, the table can help highlight when a bullish or bearish pullback condition is developing and whether both components are currently aligned or moving out of sync.
⚪ Trend Strength for Confluence
The Trend Strength Ladder provides a quick view of how strongly the indicator’s internal components agree.
Higher agreement can support stronger directional conviction, while weaker readings can highlight mixed conditions or increasing conflict between the underlying trend signals.
Values around the middle area, approximately 40–60, can indicate that the internal trend structure is less decisive. This can happen during consolidation, pullbacks, or when the market is beginning to transition from one trend condition into another.
For this reason, the Trend Strength Ladder is best used as confluence together with the Trend and Range oscillators rather than as a standalone entry signal.
Bullish Example
Bearish Example
⚪ Trend Candles
One way to use the Trend Candles is as a higher-timeframe trend filter.
For example, turn on the Trend Candles on a higher timeframe such as the 1-hour or 15-minute chart and increase the Significance value to above approximately 230. This creates a slower and more selective reading that can help highlight longer-term strong trend conditions.
You can then split your screen and monitor a lower timeframe, such as the 5-minute chart, to look for bullish or bearish pullbacks that align with the stronger higher-timeframe Trend Candles.
For example, if the higher timeframe continues showing a strong bullish trend, the lower timeframe can be used to identify temporary bearish pullbacks and potential areas where the larger bullish move may resume. The same approach can be reversed during stronger bearish trends.
█ How It Works
⚪ Dual-Phase Quant Model
The indicator processes market behavior through two independently evolving analytical phases. Each phase is normalized into a comparable state space, allowing directional pressure, persistence, and behavioral shifts to be evaluated on a common scale.
⚪ Phase Differential Engine
The system continuously measures the relative displacement between both phases and evaluates how that relationship changes over time.
Phase distance, directional agreement, persistence, and transition velocity are combined into an internal coherence model designed to distinguish synchronized conditions from temporary dislocations and developing regime shifts.
⚪ Pullback State Model
Pullback conditions are identified through a multi-factor state assessment that evaluates phase separation, directional persistence, relative positioning, and recovery behavior. Instead of reacting to a single threshold event, the model tracks whether the internal imbalance is strengthening, stabilizing, degrading, or beginning to normalize.
⚪ Composite Trend Strength
The indicator combines normalized phase agreement, directional consistency, momentum persistence, and internal coherence into a composite strength framework.
The resulting score is dynamically scaled to represent the degree of alignment between the system’s internal states, providing a simplified view of conviction, transition, and structural conflict.
-----------------
Disclaimer
The content provided in my scripts, indicators, ideas, algorithms, and systems is for educational and informational purposes only. It does not constitute financial advice, investment recommendations, or a solicitation to buy or sell any financial instruments. I will not accept liability for any loss or damage, including without limitation any loss of profit, which may arise directly or indirectly from the use of or reliance on such information.
All investments involve risk, and the past performance of a security, industry, sector, market, financial product, trading strategy, backtest, or individual's trading does not guarantee future results or returns. Investors are fully responsible for any investment decisions they make. Such decisions should be based solely on an evaluation of their financial circumstances, investment objectives, risk tolerance, and liquidity needs.
Информация о релизе
Major Improvements!- Improved calculations for better accuracy.
Best
Информация о релизе
Major Improvements! - Display short or long-term trend shifts!
- Alerts added!
Информация о релизе
Improvements! - Trend Alerts added!
Информация о релизе
Improvements! - Performance Improvements
- Tooltips Added
- Alerts Added
Информация о релизе
- Performance Improvements
Информация о релизе
- Performance Improvements
- New calculation to visualize the trend
- Trend pullback added
Информация о релизе
A new trend analysis calculation that provides clearer interpretation and simpler usabilityИнформация о релизе
- Range Trend Oscillator added
- Trend Strength Meter added
- Strong Trend Detection added
Информация о релизе
Added Range and Trend labels, a relationship table, and bullish and bearish pullback detection to make oscillator interactions easier to interpret.Доступно в разделе с платным контентом
Этот индикатор доступен только подписчикам Zeiierman . Подписывайтесь и получайте доступ к этому и другим скриптам от Zeiierman.

Access my indicators at: zeiierman.com
Join Our Free Discord: discord.gg/zeiiermantrading
Join Our Free Discord: discord.gg/zeiiermantrading
Отказ от ответственности
Информация и публикации не предназначены для предоставления и не являются финансовыми, инвестиционными, торговыми или другими видами советов или рекомендаций, предоставленных или одобренных TradingView. Подробнее читайте в Условиях использования.
Доступно в разделе с платным контентом
Этот индикатор доступен только подписчикам Zeiierman . Подписывайтесь и получайте доступ к этому и другим скриптам от Zeiierman.
Access my indicators at: zeiierman.com
Join Our Free Discord: discord.gg/zeiiermantrading
Join Our Free Discord: discord.gg/zeiiermantrading
Отказ от ответственности
Информация и публикации не предназначены для предоставления и не являются финансовыми, инвестиционными, торговыми или другими видами советов или рекомендаций, предоставленных или одобренных TradingView. Подробнее читайте в Условиях использования.