OPEN-SOURCE SCRIPT
ZIZO Zone Projector (Simplified)
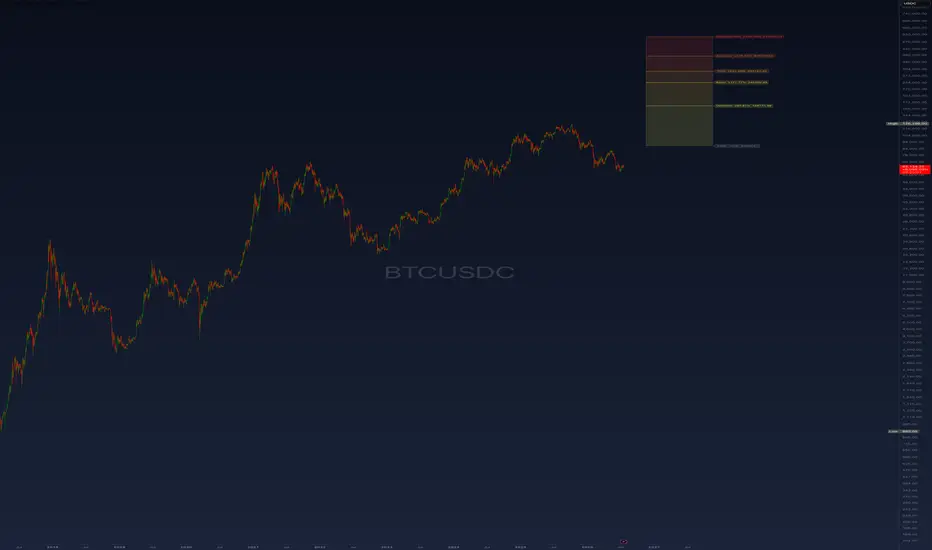
ZIZO Zone Projector (Simplified)
Static, fixed-anchor deviation zones projected forward from a 200 SMA cross.
Overview
The Zone Projector draws a set of horizontal "cycle zones" above or below a single anchor price. The anchor is the price where a 200-day SMA cross happened. From that anchor it projects five upside zones and five downside zones as fixed percentage offsets, then extends them across a date range you choose.
It answers one question: if this cross marks the start of a leg, where do the stages of that leg sit in price?
The idea
Most zone tools refit to recent data. That makes them look accurate in hindsight and vague in real time.
This does the opposite. You pick one verifiable anchor — a real 200 SMA cross price — and every level is a fixed percentage from it. Nothing moves. Nothing refits. Every number on the chart is a number you chose. That is the point: you can check it.
How it works
You enter the anchor price (the 200 SMA cross price for the active direction).
You pick a direction. Bull draws the five upside zones. Bear draws the five downside zones. Only one side is active at a time.
Each zone is a percentage offset from the anchor:
Bull level = anchor × (1 + offset%)
Bear level = anchor × (1 − offset%)
The zones are drawn from your start date forward for the duration you set.
The stages
Upside — heating up (yellow → red): Optimism, Belief, Thrill, Euphoria, Maximum Risk.
Downside — cooling off (green → blue): Anxiety, Denial, Panic, Capitulation, Maximum Opportunity.
Colours follow the ZIZO heatmap. Hotter means higher risk. Cooler means higher opportunity.
Live cycle map
A small table reads current price against the anchor. It shows the deviation and names the stage price is sitting in. The table updates with live price. The projected levels themselves stay fixed.
How to use it
Find the 200 SMA cross that starts the leg you care about. Read its price.
Enter that price as the anchor. Set direction to match — up-cross = Bull, down-cross = Bear.
Set the start date to the cross date, and a duration that covers the leg.
Adjust the offsets if you want your own calibration. Defaults are the ZIZO BTC set.
Watch the table to see which stage price is in now.
Settings
Asset & Anchor — label, direction, anchor price, start date, duration.
Offsets — the ten percentages (5 up, 5 down), at 5-decimal precision.
Visibility — turn any zone on or off. Hidden zones keep their maths; only the colour goes.
Colours — the ZIZO hot/cool palette, editable.
Style — labels, anchor line, start/finish verticals, fills, transparency, table position, decimals, line width and style.
Notes and limits
This is the manual, static version. You enter the anchor yourself. The auto-anchored MTF version finds the cross for you.
The offsets are chosen values, not a fit. Defaults are tuned for BTC. Re-tune them for other assets or other views.
The zones do not predict. They mark where chosen levels sit. Price can ignore them.
No buy/sell signals and no alerts. This is a roadmap tool, not a trigger.
The levels do not repaint. Only the table's "price now" and "stage" move, because live price moves.
This is a research and charting tool. It is not financial advice.
Open source under MPL 2.0. Read the code, verify the maths, fork it if you want.
Hard money. Don't trust. Verify.
Static, fixed-anchor deviation zones projected forward from a 200 SMA cross.
Overview
The Zone Projector draws a set of horizontal "cycle zones" above or below a single anchor price. The anchor is the price where a 200-day SMA cross happened. From that anchor it projects five upside zones and five downside zones as fixed percentage offsets, then extends them across a date range you choose.
It answers one question: if this cross marks the start of a leg, where do the stages of that leg sit in price?
The idea
Most zone tools refit to recent data. That makes them look accurate in hindsight and vague in real time.
This does the opposite. You pick one verifiable anchor — a real 200 SMA cross price — and every level is a fixed percentage from it. Nothing moves. Nothing refits. Every number on the chart is a number you chose. That is the point: you can check it.
How it works
You enter the anchor price (the 200 SMA cross price for the active direction).
You pick a direction. Bull draws the five upside zones. Bear draws the five downside zones. Only one side is active at a time.
Each zone is a percentage offset from the anchor:
Bull level = anchor × (1 + offset%)
Bear level = anchor × (1 − offset%)
The zones are drawn from your start date forward for the duration you set.
The stages
Upside — heating up (yellow → red): Optimism, Belief, Thrill, Euphoria, Maximum Risk.
Downside — cooling off (green → blue): Anxiety, Denial, Panic, Capitulation, Maximum Opportunity.
Colours follow the ZIZO heatmap. Hotter means higher risk. Cooler means higher opportunity.
Live cycle map
A small table reads current price against the anchor. It shows the deviation and names the stage price is sitting in. The table updates with live price. The projected levels themselves stay fixed.
How to use it
Find the 200 SMA cross that starts the leg you care about. Read its price.
Enter that price as the anchor. Set direction to match — up-cross = Bull, down-cross = Bear.
Set the start date to the cross date, and a duration that covers the leg.
Adjust the offsets if you want your own calibration. Defaults are the ZIZO BTC set.
Watch the table to see which stage price is in now.
Settings
Asset & Anchor — label, direction, anchor price, start date, duration.
Offsets — the ten percentages (5 up, 5 down), at 5-decimal precision.
Visibility — turn any zone on or off. Hidden zones keep their maths; only the colour goes.
Colours — the ZIZO hot/cool palette, editable.
Style — labels, anchor line, start/finish verticals, fills, transparency, table position, decimals, line width and style.
Notes and limits
This is the manual, static version. You enter the anchor yourself. The auto-anchored MTF version finds the cross for you.
The offsets are chosen values, not a fit. Defaults are tuned for BTC. Re-tune them for other assets or other views.
The zones do not predict. They mark where chosen levels sit. Price can ignore them.
No buy/sell signals and no alerts. This is a roadmap tool, not a trigger.
The levels do not repaint. Only the table's "price now" and "stage" move, because live price moves.
This is a research and charting tool. It is not financial advice.
Open source under MPL 2.0. Read the code, verify the maths, fork it if you want.
Hard money. Don't trust. Verify.
Скрипт с открытым кодом
В истинном духе TradingView, создатель этого скрипта сделал его открытым исходным кодом, чтобы трейдеры могли проверить и убедиться в его функциональности. Браво автору! Вы можете использовать его бесплатно, но помните, что перепубликация кода подчиняется нашим Правилам поведения.

Отказ от ответственности
Информация и публикации не предназначены для предоставления и не являются финансовыми, инвестиционными, торговыми или другими видами советов или рекомендаций, предоставленных или одобренных TradingView. Подробнее читайте в Условиях использования.
Скрипт с открытым кодом
В истинном духе TradingView, создатель этого скрипта сделал его открытым исходным кодом, чтобы трейдеры могли проверить и убедиться в его функциональности. Браво автору! Вы можете использовать его бесплатно, но помните, что перепубликация кода подчиняется нашим Правилам поведения.
Отказ от ответственности
Информация и публикации не предназначены для предоставления и не являются финансовыми, инвестиционными, торговыми или другими видами советов или рекомендаций, предоставленных или одобренных TradingView. Подробнее читайте в Условиях использования.