Overlay Candles STG
Core Functions & Features
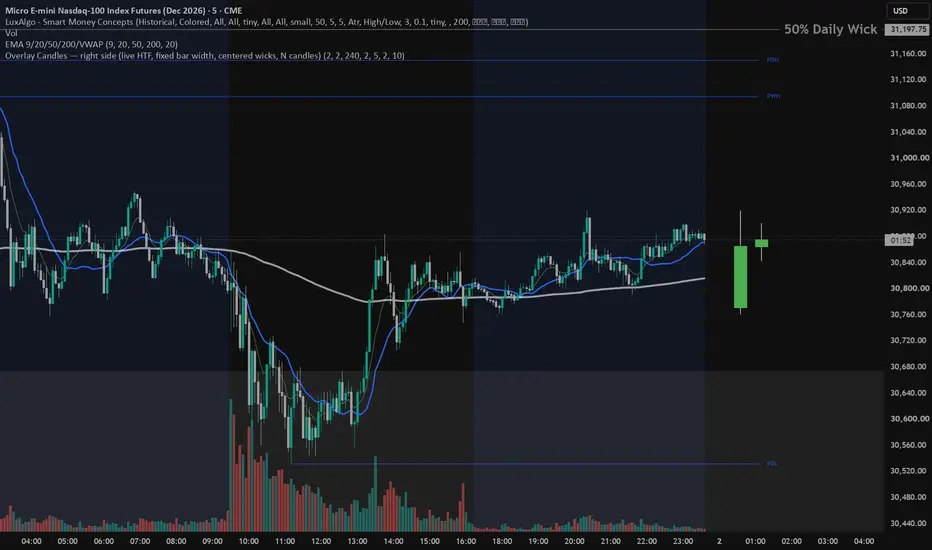
• Plots Higher Timeframes Side-by-Side: Instead of overlapping your normal chart bars, this script pulls historical and live data from a higher timeframe (e.g., Daily, Weekly, or Monthly data on a 15-minute chart) and displays a sequence of up to 8 custom HTF candles side-by-side in the right margin/blank space of your chart.
• Live Updates: It requests historical candle data using lookahead parameters (lookahead_on), meaning the very first candle on the far right updates in real-time as the live price ticks.
• Completely Customizable Geometry: Instead of relying on Pine Script’s automatic plot sizing, it manually draws boxes and lines. It forces an odd number for the bar width so that the candle wicks are perfectly centered on the box body.
• Configurable Colors: It allows you to quickly alter the interface visual parameters directly from the indicator settings window—defaulting to standard green for bullish candles and red for bearish candles with crisp black borders and wicks.
• Plots Higher Timeframes Side-by-Side: Instead of overlapping your normal chart bars, this script pulls historical and live data from a higher timeframe (e.g., Daily, Weekly, or Monthly data on a 15-minute chart) and displays a sequence of up to 8 custom HTF candles side-by-side in the right margin/blank space of your chart.
• Live Updates: It requests historical candle data using lookahead parameters (lookahead_on), meaning the very first candle on the far right updates in real-time as the live price ticks.
• Completely Customizable Geometry: Instead of relying on Pine Script’s automatic plot sizing, it manually draws boxes and lines. It forces an odd number for the bar width so that the candle wicks are perfectly centered on the box body.
• Configurable Colors: It allows you to quickly alter the interface visual parameters directly from the indicator settings window—defaulting to standard green for bullish candles and red for bearish candles with crisp black borders and wicks.

Отказ от ответственности
Информация и публикации не предназначены для предоставления и не являются финансовыми, инвестиционными, торговыми или другими видами советов или рекомендаций, предоставленных или одобренных TradingView. Подробнее читайте в Условиях использования.
Отказ от ответственности
Информация и публикации не предназначены для предоставления и не являются финансовыми, инвестиционными, торговыми или другими видами советов или рекомендаций, предоставленных или одобренных TradingView. Подробнее читайте в Условиях использования.