Volumetric Energy Profiles (VEP) [The Quant Science]
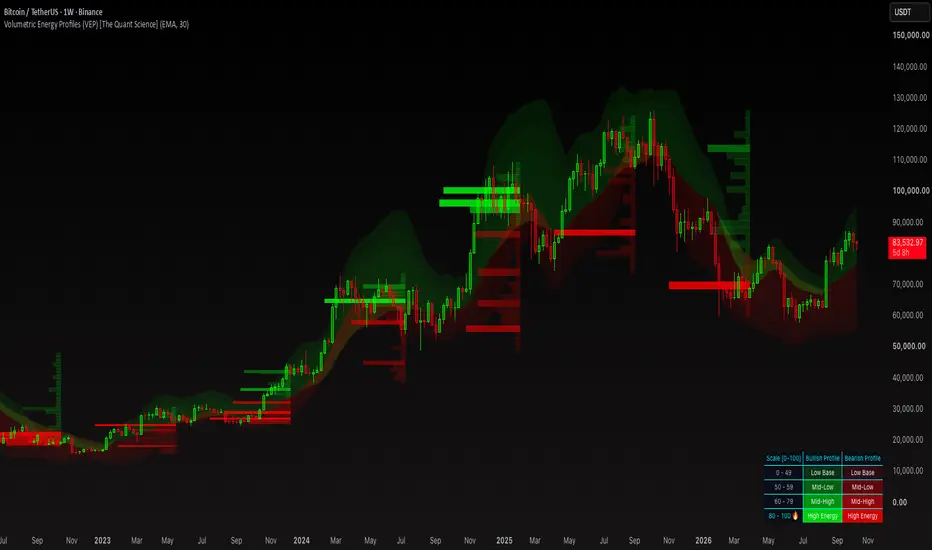
An advanced quantitative indicator that maps volatility in a two-dimensional manner by combining price volatility bands with volumetric energy profiles.

1. The Price Dimension
The script calculates the percentage ratio of the price relative to the moving average, measures its standard deviation, and generates dynamic channels. This dimension visually shows when volatility contracts (narrow bands) or expands (wide bands).


2. The Volume Dimension
The horizontal profiles do not simply measure "where volumes are most volatile", but instead calculate a combined energy score by multiplying the True Range by Volume. This dimension maps where the highest energy—combining price and volume—has concentrated within that time block. In simple terms, it identifies the "heaviest and most intense" price levels where the market has moved significant volume accompanied by real price swings.

🔷 What it does
🔹 1. The Dynamic Volatility Bands
It calculates a Moving Average and plots dynamic bands based on standard deviation (Sigma) multiples. This component does not calculate the standard deviation directly on the raw price, but rather on the percentage deviation of the price relative to the moving average, thus normalizing volatility across different timeframes.
🔹 2. The Normalized Volatility Profile Engine (0–100)
Transforms a time series into a vertical block histogram. It periodically divides historical data into vertical blocks (default: every 30 bars) and generates horizontal bar profiles normalized on a scale from 0 to 100.
🔷 What It Is Used For
Thanks to its two-dimensional nature, it is primarily used to:
🔹 Identify Breakout and Consolidation Zones (Breakout & Range)
🔹 Identify Volatility and Volume "Points of Control" (HVN/LVN)
The block-based horizontal profiles function similarly to a dynamic Volume Profile. The longer bars (highlighted by score levels reaching up to 100) reveal high-energy price levels, which frequently act as powerful dynamic support or resistance. Areas lacking profiles or exhibiting low intensity indicate vacuum zones where price can move rapidly (acceleration zones).
🔹 Risk Management and Dynamic Stop Losses
Bands based on volatility standard deviation (Sigma) multiples allow traders to adapt stop loss and take profit levels to current market volatility, preventing premature stop-outs during periods of normal price fluctuations.
🔹 Trend Strength Analysis
The code visually distinguishes between bullish zones and bearish zones. The density of the profiles within these areas indicates whether the directional move is backed by real volumes and price swings or driven by weak trading activity.
🔷 Who Uses It
This advanced indicator is a highly versatile tool for both quantitative and technical traders.
🔷 How to Use It
In the settings panel, select the moving average type.
Adjust Bars per Profile Block (default: 30 bars) to define the frequency with which new volume profiles are generated.

It works on any timeframe, but performs best on liquid assets where volume data is accurate and meaningful.
Dashboard
Real-time visual guide for interpreting volatility block density and color coding.

The dashboard is structured into 3 columns and 4 intensity levels.
Columns
Scale [0–100] Column: Displays the normalized numerical scale of the energy score.
Bullish Profile Column: Displays the block colors and opacity when positioned above the moving average.
Bearish Profile Column: Displays the block colors and opacity when positioned below the moving average.
Intensity Bands
0–49 (Low Base): The blocks are highly transparent and thin. They represent "cold" price zones with minimal movement or negligible trading activity.
50–59 (Mid-Low): An intermediate intensity level indicating normal market activity.
60–79 (Mid-High): The area becomes denser and more visible, signaling growing trader interest at that price level.
80–100 🔥 (High Energy): These are the most vibrant, solid, and horizontally extended blocks on the chart. They represent true energetic Points of Control ("hot" levels) where the market concentrated maximum volumetric momentum and price excursion.
1. The Price Dimension
The script calculates the percentage ratio of the price relative to the moving average, measures its standard deviation, and generates dynamic channels. This dimension visually shows when volatility contracts (narrow bands) or expands (wide bands).
2. The Volume Dimension
The horizontal profiles do not simply measure "where volumes are most volatile", but instead calculate a combined energy score by multiplying the True Range by Volume. This dimension maps where the highest energy—combining price and volume—has concentrated within that time block. In simple terms, it identifies the "heaviest and most intense" price levels where the market has moved significant volume accompanied by real price swings.
🔷 What it does
🔹 1. The Dynamic Volatility Bands
It calculates a Moving Average and plots dynamic bands based on standard deviation (Sigma) multiples. This component does not calculate the standard deviation directly on the raw price, but rather on the percentage deviation of the price relative to the moving average, thus normalizing volatility across different timeframes.
🔹 2. The Normalized Volatility Profile Engine (0–100)
Transforms a time series into a vertical block histogram. It periodically divides historical data into vertical blocks (default: every 30 bars) and generates horizontal bar profiles normalized on a scale from 0 to 100.
- Block-Based Time Partitioning
The indicator partitions time into discrete, fixed-width blocks (default: 30 bars). - Price Range / Price Extension
For each block, it identifies the absolute high and low prices reached. - Price Binning / Price Bin Subdivision
The total vertical range is divided into a predefined number of discrete intervals (referred to as bins). - Bar-Weighted Energy Score
For each bar within the block, an "energy score" is calculated by combining the actual price excursion (True Range) and Volume. - Min-Max Normalization (0–100)
To make different blocks comparable regardless of the volume traded at different times, the raw weights are normalized relative to the maximum weight recorded within that single block. - Width Conversion / Translation to Width
Finally, the normalized score (from 1 to 100) is converted into the horizontal width of the profiles drawn on the chart. As a result, price levels with higher energy concentration receive a score close to 100 and render wider horizontal bars within the time block.
🔷 What It Is Used For
Thanks to its two-dimensional nature, it is primarily used to:
🔹 Identify Breakout and Consolidation Zones (Breakout & Range)
- Volatility compression: When the dynamic bands contract significantly and the profile blocks concentrate within a narrow price range, the market is accumulating energy.
- Volatility Expansion: A breakout from these areas often signals the beginning of a strong trend, helping to filter out false signals.
🔹 Identify Volatility and Volume "Points of Control" (HVN/LVN)
The block-based horizontal profiles function similarly to a dynamic Volume Profile. The longer bars (highlighted by score levels reaching up to 100) reveal high-energy price levels, which frequently act as powerful dynamic support or resistance. Areas lacking profiles or exhibiting low intensity indicate vacuum zones where price can move rapidly (acceleration zones).
🔹 Risk Management and Dynamic Stop Losses
Bands based on volatility standard deviation (Sigma) multiples allow traders to adapt stop loss and take profit levels to current market volatility, preventing premature stop-outs during periods of normal price fluctuations.
🔹 Trend Strength Analysis
The code visually distinguishes between bullish zones and bearish zones. The density of the profiles within these areas indicates whether the directional move is backed by real volumes and price swings or driven by weak trading activity.
🔷 Who Uses It
This advanced indicator is a highly versatile tool for both quantitative and technical traders.
🔷 How to Use It
In the settings panel, select the moving average type.
Adjust Bars per Profile Block (default: 30 bars) to define the frequency with which new volume profiles are generated.
It works on any timeframe, but performs best on liquid assets where volume data is accurate and meaningful.
Dashboard
Real-time visual guide for interpreting volatility block density and color coding.
The dashboard is structured into 3 columns and 4 intensity levels.
Columns
Scale [0–100] Column: Displays the normalized numerical scale of the energy score.
Bullish Profile Column: Displays the block colors and opacity when positioned above the moving average.
Bearish Profile Column: Displays the block colors and opacity when positioned below the moving average.
Intensity Bands
0–49 (Low Base): The blocks are highly transparent and thin. They represent "cold" price zones with minimal movement or negligible trading activity.
50–59 (Mid-Low): An intermediate intensity level indicating normal market activity.
60–79 (Mid-High): The area becomes denser and more visible, signaling growing trader interest at that price level.
80–100 🔥 (High Energy): These are the most vibrant, solid, and horizontally extended blocks on the chart. They represent true energetic Points of Control ("hot" levels) where the market concentrated maximum volumetric momentum and price excursion.

Отказ от ответственности
Информация и публикации не предназначены для предоставления и не являются финансовыми, инвестиционными, торговыми или другими видами советов или рекомендаций, предоставленных или одобренных TradingView. Подробнее читайте в Условиях использования.
Отказ от ответственности
Информация и публикации не предназначены для предоставления и не являются финансовыми, инвестиционными, торговыми или другими видами советов или рекомендаций, предоставленных или одобренных TradingView. Подробнее читайте в Условиях использования.