OPEN-SOURCE SCRIPT
Auto Trend Drawing [LuxAlgo]
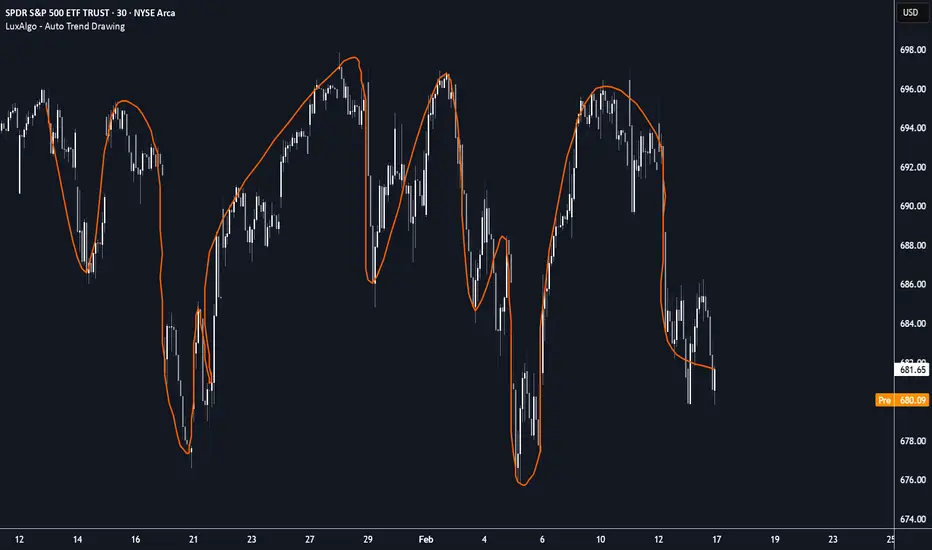
The Auto Trend Drawing indicator summarizes price action into a smooth, continuous curve that highlights the primary market direction and structure.
It is mostly a fun and silly experiment in reproducing users attempts at drawing trends on the chart using the brush tool.
🔶 USAGE
The Auto Trend Drawing tool provides a clean, visual representation of the current market "flow" by stripping away minor price noise and focusing on significant pivot points. Traders can use this indicator to quickly identify the prevailing trend, potential trend reversals, and the overall rhythm of the market.
Unlike standard trendlines that connect two specific points, this indicator creates a dynamic curve that adapts to the most significant price movements within a user-defined window.
🔹 Trend Identification
🔶 DETAILS
The script employs a multi-step process to generate the trend curve:
🔶 SETTINGS
It is mostly a fun and silly experiment in reproducing users attempts at drawing trends on the chart using the brush tool.
This indicator is subject to repainting and is displayed retrospectively based on the most recent price data.
🔶 USAGE
The Auto Trend Drawing tool provides a clean, visual representation of the current market "flow" by stripping away minor price noise and focusing on significant pivot points. Traders can use this indicator to quickly identify the prevailing trend, potential trend reversals, and the overall rhythm of the market.
Unlike standard trendlines that connect two specific points, this indicator creates a dynamic curve that adapts to the most significant price movements within a user-defined window.
🔹 Trend Identification
- Bullish Flow: When the curve is sloping upward and the price generally stays above or near the curve's trajectory.
- Bearish Flow: When the curve is sloping downward and the price remains below or near the curve's trajectory.
- Consolidation: When the curve flattens out, indicating a lack of clear directional momentum.
🔶 DETAILS
The script employs a multi-step process to generate the trend curve:
- Normalization: Price data is normalized using the Average True Range (ATR). This ensures that the simplification process remains consistent across different assets and timeframes regardless of their volatility.
- Ramer-Douglas-Peucker (RDP) Algorithm: This algorithm identifies the most "important" anchor points in the price series by recursively simplifying the path. It removes points that deviate less than a certain threshold (set by the Simplification Multiplier) from a straight line.
- Catmull-Rom Splines: Once the key anchor points are identified, the script uses Catmull-Rom spline interpolation to connect them. This creates a smooth, aesthetic curve that passes through every identified anchor point, providing a more "organic" look than jagged lines.
🔶 SETTINGS
- Window Size: Determines the number of recent bars the indicator analyzes to build the curve.
- Simplification Multiplier: Controls the sensitivity of the trend detection. Higher values filter out more noise, resulting in a smoother, more "macro" curve. Lower values allow the curve to follow price more closely.
- ATR Length: The period used for the ATR normalization process.
- Curve Tension: Adjusts how tightly the spline curve follows the anchor points. A value of 0.5 is centripetal, while higher or lower values change the curvature between points.
- Curve Resolution: Sets the number of sub-points calculated between each anchor. Higher values result in a smoother-looking line.
- Line Color: Changes the color of the trend curve.
- Line Width: Adjusts the thickness of the displayed curve.
Скрипт с открытым кодом
В истинном духе TradingView, создатель этого скрипта сделал его открытым исходным кодом, чтобы трейдеры могли проверить и убедиться в его функциональности. Браво автору! Вы можете использовать его бесплатно, но помните, что перепубликация кода подчиняется нашим Правилам поведения.

All content & scripts provided by LuxAlgo are for educational purposes only and are not financial advice.
Отказ от ответственности
Информация и публикации не предназначены для предоставления и не являются финансовыми, инвестиционными, торговыми или другими видами советов или рекомендаций, предоставленных или одобренных TradingView. Подробнее читайте в Условиях использования.
Скрипт с открытым кодом
В истинном духе TradingView, создатель этого скрипта сделал его открытым исходным кодом, чтобы трейдеры могли проверить и убедиться в его функциональности. Браво автору! Вы можете использовать его бесплатно, но помните, что перепубликация кода подчиняется нашим Правилам поведения.
Отказ от ответственности
Информация и публикации не предназначены для предоставления и не являются финансовыми, инвестиционными, торговыми или другими видами советов или рекомендаций, предоставленных или одобренных TradingView. Подробнее читайте в Условиях использования.