OPEN-SOURCE SCRIPT
MTF CVD Synchrony | Rainbow Matrix
GENERAL OVERVIEW
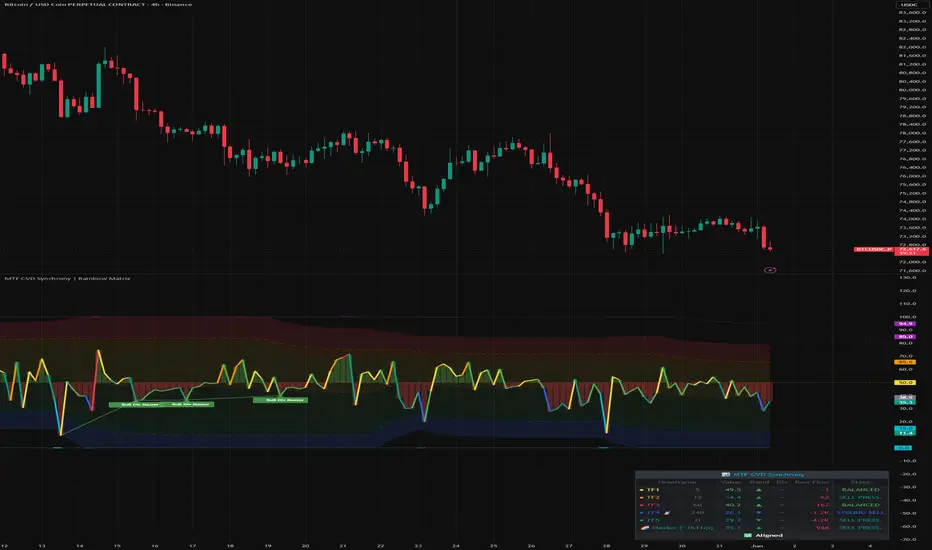
MTF CVD Synchrony is a multi-timeframe directional flow oscillator that condenses five independent CVD (Cumulative Volume Delta) readings — one per Fibonacci-spaced timeframe — into a single weighted Master Line on a zero-centered 0-100 scale, surrounded by per-TF "ghost lines" that fade visually as they diverge from the consensus. The defining feature: 50 is true neutral. Above 50 means buyers are dominating; below 50 means sellers are dominating. The further from 50, the stronger the directional pressure. When the five timeframes align, the rainbow becomes a solid band; when they diverge, the disagreement becomes a visible density property of the indicator itself.
A background histogram visualizes the Master score's deviation from the neutral 50 line — green columns extend up when buyers dominate, red columns extend down when sellers dominate. A compact 7×9 MTF Legend Table surfaces every dimension simultaneously: per-TF resolutions, score values, trend direction, divergence flags, raw flow magnitude, and named directional State — with an antenna marker flagging the row whose timeframe matches your chart's native resolution.
Designed as the directional member of a three-indicator family. Apply all three side-by-side for a complete read: MTF RSI Synchrony shows where price sits in its momentum range; MTF Volume Delta Bar Synchrony shows whether the move has volume magnitude behind it; MTF CVD Synchrony shows who is actually winning — buyers or sellers. Same visual signature, same canonical Fibonacci ratios, same Legend Table layout — instant cross-indicator readability.
WHAT IS THE THEORY BEHIND THIS INDICATOR
Cumulative Volume Delta attempts to answer a question that price and volume alone cannot: in any given bar, were buyers or sellers more aggressive? Traditional volume tells you HOW MUCH traded, but not the DIRECTION of the pressure. A high-volume bar that closes flat tells a very different story from a high-volume bar that closes at its highs — yet raw volume scores them identically.
CVD approximates directional pressure by weighting each bar's volume by where price closed within its range. This indicator uses the Close Location Value (CLV) for that weighting:
clv = ((close − low) − (high − close)) / (high − low)
CLV ranges from +1 (close exactly at the high — maximum buying pressure) to −1 (close exactly at the low — maximum selling pressure), with 0 at the midpoint. Multiplying CLV by volume produces a signed directional contribution per bar: delta_raw = clv × volume. This is more nuanced than the binary tick rule (close > open = buy) used by most "delta" indicators — CLV captures HOW DECISIVELY price closed in its range, not just the sign.
The per-bar delta is then smoothed by EMA and normalized into a bounded 0-100 zero-centered score:
cvd_smooth = EMA(delta_raw, smoothing_length)
max_abs = highest(|cvd_smooth|, normalization_window)
score = 50 + (cvd_smooth / max_abs) × 50 [clamped 0-100]
The genius of the zero-centered approach: 50 always means balance, regardless of the asset's structural bias. A score of 75 means buyers are exerting 50% of the maximum recent pressure to the upside; a score of 25 means sellers are exerting 50% of maximum recent pressure to the downside. This is fundamentally different from a percentile rank (which would anchor 50 at the historical median, skewing with structural trends).
Five such scores — one per timeframe (default 5 / 15 / 60 / 240 / D) — are fused via canonical Fibonacci weights (0.15 / 0.20 / 0.25 / 0.25 / 0.15, peak weight on the macro TF3/TF4 where institutional positioning consolidates) into the weighted Master Line.
FEATURES
🔹 Multi-Timeframe CVD Fusion Engine (zero-centered directional scale)
🔹 CVD Histogram (deviation from neutral 50 — green buy / red sell)
🔹 Adaptive Fibonacci Channel (Z-Breathing → Z-Alert → Z-Exhaustion → Black Swan)
🔹 Hybrid Black Swan Zones (static or dynamic — default dynamic)
🔹 Classic Price↔CVD Divergence Detection (per-TF + Master)
🔹 MTF Legend Table (7 columns × 9 rows, with Raw Flow + State, multilingual)
🔹 Multilingual Interface (EN / PT / ES / RU / ZH)
🔹 Multi-Timeframe CVD Fusion Engine
What It Does
Runs five independent CVD scores on Fibonacci-spaced timeframes and fuses them into a single weighted Master Line, with each per-TF reading plotted as a ghost line that fades by distance to the consensus.
Method
On each timeframe, f_cvd_full() computes CLV × volume per bar, smooths it via EMA, and normalizes against a rolling-max window to produce the zero-centered score. The five scores fuse via Fibonacci weights (0.15 / 0.20 / 0.25 / 0.25 / 0.15). Both smoothing length and normalization window are independently configurable per timeframe.
Per-TF smoothing defaults (Wilder-anchored on TF3+TF4):
◇ TF1 (5m): 7 — scalping
◇ TF2 (15m): 10 — day-trading
◇ TF3 (60m): 14 — Wilder canonical
◇ TF4 (240m): 14 — Wilder canonical
◇ TF5 (D): 21 — swing/position
Per-TF normalization windows (each TF's natural horizon):
◇ TF1: 30 (≈2.5h on 5m)
◇ TF2: 50 (≈12.5h on 15m)
◇ TF3: 80 (≈3.3 days on 1h)
◇ TF4: 100 (≈16 days on 4h)
◇ TF5: 150 (≈5 months on Daily)
All request.security calls use lookahead=barmerge.lookahead_off for anti-repaint integrity.
Why It Matters
A 5-minute buy surge means little if the 4-hour and daily flows are decisively selling. The fusion engine reveals whether directional pressure is aligned across timescales (high conviction) or contradictory (a counter-trend bounce inside a larger trend). The ghost-line rainbow makes that alignment visible at a glance.
🔹 Adaptive Fibonacci Channel
What It Does
Six color-coded bands around the Master Line that adapt to its own recent volatility, using the brand's canonical Fibonacci ratios.
Method
Highest/lowest of the Master over a configurable lookback (default 50) are smoothed by EMA (default 10) to form the channel envelope. Bands sit at canonical Fibonacci proportions: Z-Breathing (1.50/1.85), Z-Alert (1.85σ anchor), Z-Exhaustion (2.75/1.85), Black Swan (3.85/1.85). All six band values are mathematically clamped to [0,100] before rendering, keeping the rainbow inside the visible pane.
Why It Matters
Static thresholds can't adapt to regime changes. The Fibonacci channel calibrates the warning zones to the asset's current directional-flow volatility, so a "climax" on a calm pair and a "climax" on a volatile one both trigger at appropriate statistical extremes.
🔹 Hybrid Black Swan Zones
What It Does
Flags directional flow climax extremes — either at static 85/15 thresholds (BUY CLIMAX / SELL CLIMAX boundaries) or at the dynamic Fibonacci 3.85σ band.
Method
Dynamic Black Swan Mode is ON by default (Fibonacci 3.85σ proportion of the Master channel). Toggle OFF for static 85/15. Each zone renders as a glow line that brightens as the Master approaches. The static reference lines (15/50/85) are shown by default to anchor the zero-centered scale: 85 = purple (buy climax boundary), 50 = yellow (neutral), 15 = aqua (sell climax boundary).
Why It Matters
Directional flow climaxes mark exhaustion points — a BUY CLIMAX (score ≥ 85) means buyers have pushed to a recent extreme, often preceding a pause or reversal; a SELL CLIMAX (≤ 15) marks capitulation. The dynamic mode self-calibrates per asset and regime.
🔹 Classic Price↔CVD Divergence Detection
What It Does
Detects regular bear divergences (price higher high while CVD makes lower high — rally on weakening buy pressure) and bull divergences (price lower low while CVD makes higher low — selling exhausting). Runs on each timeframe AND on the Master line.
Method
Per-TF divergence runs inside request.security via pivot detection on the per-TF CVD score. Master divergence runs on the chart-TF directly, rendering a connecting line + label between pivots (red bear / green bull) on the pane. Per-TF results surface in the Legend Table's "Div" column.
Why It Matters
Price↔flow divergence is one of the most powerful applications of CVD. When price makes a new high but directional flow doesn't confirm, the rally is running on fading conviction — a classic distribution warning. Detecting this per-TF AND on the Master gives both early granular warnings and high-conviction confirmations.
🔹 MTF Legend Table
What It Does
A compact 7×9 table surfacing every dimension of the analysis at a glance.
Method
Rendered via table.new(force_overlay=false) on the pane. Layout:
◇ Row 0: title (spans all columns)
◇ Row 1: column headers — Indicator / Timeframe / Value / Trend / Div / Raw / State
◇ Rows 2-6: per-TF data
◇ Row 7: Master row ("🌈 Master (~XhYm)" with effective TF)
◇ Row 8: MTF Divergence status row
Per-TF cells show: ● TF label (+ antenna 📡 if chart-native), TF resolution, zero-centered score (zone-colored), trend arrow (±0.5 deadzone), divergence (🔺/🔻/—), Raw Flow (compact K/M/B signed magnitude, green if positive / red if negative), and State (directional name, zone-colored).
Why It Matters
The Raw Flow column complements the Value column: Value answers "how strong is the directional pressure?" (the normalized score), while Raw answers "how much actual volume is behind it?" (the absolute flow). A score of 75 with a small raw magnitude is weaker conviction than 75 with a huge raw magnitude. Together with State, the table tells a complete directional story per timeframe.
🔹 Multilingual Interface
What It Does
Translates all HUD labels, status messages, alert text, Legend Table headers, and directional State names to 5 languages: English, Português, Español, Русский, 中文.
Method
A single language dropdown selects the active language via Pine v6's ternary-chain pattern. Code, comments, and configuration tooltips remain in English by convention.
Why It Matters
The Rainbow Matrix family is built for traders worldwide. Multilingual UI removes friction for non-English-native users.
HOW TO USE
Reading the Pane
◇ Master near 50 with ghost lines tight: balanced flow, no directional edge (absorption / equilibrium).
◇ Master rising above 50: buyers gaining control. Above 62 = BUY PRESSURE; above 71 = STRONG BUY.
◇ Master falling below 50: sellers gaining control. Below 38 = SELL PRESSURE; below 29 = STRONG SELL.
◇ Master touches Black Swan High (≥85, purple glow): BUY CLIMAX — buyers at a recent extreme, watch for exhaustion.
◇ Master touches Black Swan Low (≤15, aqua glow): SELL CLIMAX — capitulation, watch for reversal.
◇ Histogram green/red columns: immediate bar-by-bar directional read around the 50 centerline.
Reading the Legend Table
The antenna marker (📡) flags your chart's native timeframe — start there, then scan up/down to see whether faster/slower TFs confirm or contradict the directional bias. Compare Value (pressure strength), Raw (actual flow magnitude), and State (named classification) for each row. The status row summarizes MTF alignment between TF1 and TF5.
Reading Divergences
Master bear divergence (price up + CVD down) = rally on fading buy conviction, distribution warning. Master bull divergence (price down + CVD up) = selling exhausting, potential bottom. Per-TF divergences in the Div column give early granular warnings.
Tactical Combinations
◇ Master BUY CLIMAX + bear divergence + multiple TFs diverging = strongest reversal-from-high signal.
◇ Master SELL CLIMAX + bull divergence = strongest reversal-from-low signal.
◇ Master near 50 + all TFs near 50 + tight ghosts = absorption / coiling, often precedes a directional break.
◇ Triple confluence (the full family): RSI overbought + Volume EXTREME magnitude + CVD STRONG SELL = distribution at the top. RSI oversold + Volume EXTREME + CVD STRONG BUY = accumulation at the bottom. These three indicators answering momentum + magnitude + direction simultaneously is the strongest read the Rainbow Matrix family offers.
INPUTS EXPLAINED
GLOBAL SETTINGS — System Language (EN/PT/ES/RU/ZH), table/label font sizes.
MULTI-TIMEFRAME — AI Auto-Sync TFs; TF1-TF5 manual resolutions (default 5/15/60/240/D); per-TF CVD Smoothing Length (7/10/14/14/21); per-TF CVD Normalization Window (30/50/80/100/150).
ENGINE — Dynamic Black Swan Mode (default ON); Dynamic Channel Lookback (50) and Smoothing (10); Divergence Pivot Lookback (5).
VISUALIZATION — TF1-TF5 colors + show toggles (all ghost lines OFF by default — only Master visible on install); Ghost Fade Sensitivity (3.5); Show Master Line / Rainbow Fills / Black Swan / Dynamic Channel; Show CVD Histogram; Show MTF Legend Table; Show Divergence Column; Show Raw Flow Column; Show State Column; Show Master Divergence Chart Line; Legend position; Show Divergence Event Markers; Show Static Reference Lines (15/50/85, ON by default).
ALERTS — Black Swan crossings (high/low); Strong MTF Divergence; Z-Exhaustion zone entries; Master Classic Divergence.
IMPORTANT NOTES
🔸 Pine Script v6 — uses request.security with lookahead=barmerge.lookahead_off. 16 total security calls (5 CVD score + 5 per-TF divergence + supporting channel calculations). Chart load may take a moment longer than a single-TF indicator.
🔸 CLV approximation, not order-flow tick data — Directional pressure is approximated via the Close Location Value (where price closed within each bar's range), NOT real bid/ask order flow. Pine Script v6 has no tick-by-tick data access in indicator scripts. CLV is a more nuanced approximation than the binary tick rule used by most free-tier "delta" indicators, but it remains an approximation. For true order-flow delta, use dedicated footprint/order-flow tools.
🔸 Zero-centered scale — Unlike the percentile-rank siblings (RSI, Volume Delta Bar), this indicator's 50 is a TRUE neutral (zero net directional flow), not a historical median. This is intentional — direction is inherently signed, so a fixed zero-point is more meaningful than a regime-relative median.
🔸 Normalization warmup — During the first normalization_window bars on each TF, the rolling-max anchor (max_abs) is built from a small sample, so early bars may show exaggerated swings until the window fills. Normal warmup behavior for any rolling-window indicator.
🔸 Repaint behavior — Historical bars use confirmed close data; the current real-time bar updates as ticks arrive. Pivot-based divergence requires confirmation bars before triggering (standard pivot divergence behavior).
🔸 Fibonacci ratios are canonical — The channel proportions (1.50/1.85/2.75/3.85) and fusion weights (0.15/0.20/0.25/0.25/0.15) match the Rainbow Matrix brand standard across all sibling indicators, preserving cross-indicator visual consistency.
🔸 License: MPL 2.0 — open source. Free to fork, modify, and republish under the same license terms.
UNIQUENESS
Three pillars differentiate this from other CVD indicators on TradingView:
1. Multi-timeframe CVD fusion with synchrony as a visual property. Most CVD tools run on a single timeframe. This indicator runs five, fuses them via Fibonacci weights, and expresses directional alignment as a rainbow density — solid when timeframes agree on direction, spread when they disagree. The cross-TF directional consensus becomes immediately readable.
2. True zero-centered scale with CLV weighting. The 50 midpoint is a mathematically meaningful neutral (zero net flow), not a regime-skewed median. And the directional weighting uses Close Location Value — capturing how decisively price closed within each bar's range — rather than the cruder binary tick rule. This combination produces a directional read that stays honest across structural trends.
3. Three complementary readings in one Legend Table, designed as a family. Value (pressure strength), Raw Flow (actual magnitude), and State (named classification) disambiguate a single timeframe's directional picture. And as the directional member of the Rainbow Matrix trio (alongside RSI for momentum and Volume Delta Bar for magnitude), it completes a three-dimensional read of any market: where price is, how big the move is, and who's winning.
Rainbow Matrix AI | Multi-timeframe institutional analysis tools for traders.
🌐 rainbowmatrix.ai
✉️ Contact: contact@rainbowmatrix.ai
MTF CVD Synchrony is a multi-timeframe directional flow oscillator that condenses five independent CVD (Cumulative Volume Delta) readings — one per Fibonacci-spaced timeframe — into a single weighted Master Line on a zero-centered 0-100 scale, surrounded by per-TF "ghost lines" that fade visually as they diverge from the consensus. The defining feature: 50 is true neutral. Above 50 means buyers are dominating; below 50 means sellers are dominating. The further from 50, the stronger the directional pressure. When the five timeframes align, the rainbow becomes a solid band; when they diverge, the disagreement becomes a visible density property of the indicator itself.
A background histogram visualizes the Master score's deviation from the neutral 50 line — green columns extend up when buyers dominate, red columns extend down when sellers dominate. A compact 7×9 MTF Legend Table surfaces every dimension simultaneously: per-TF resolutions, score values, trend direction, divergence flags, raw flow magnitude, and named directional State — with an antenna marker flagging the row whose timeframe matches your chart's native resolution.
Designed as the directional member of a three-indicator family. Apply all three side-by-side for a complete read: MTF RSI Synchrony shows where price sits in its momentum range; MTF Volume Delta Bar Synchrony shows whether the move has volume magnitude behind it; MTF CVD Synchrony shows who is actually winning — buyers or sellers. Same visual signature, same canonical Fibonacci ratios, same Legend Table layout — instant cross-indicator readability.
WHAT IS THE THEORY BEHIND THIS INDICATOR
Cumulative Volume Delta attempts to answer a question that price and volume alone cannot: in any given bar, were buyers or sellers more aggressive? Traditional volume tells you HOW MUCH traded, but not the DIRECTION of the pressure. A high-volume bar that closes flat tells a very different story from a high-volume bar that closes at its highs — yet raw volume scores them identically.
CVD approximates directional pressure by weighting each bar's volume by where price closed within its range. This indicator uses the Close Location Value (CLV) for that weighting:
clv = ((close − low) − (high − close)) / (high − low)
CLV ranges from +1 (close exactly at the high — maximum buying pressure) to −1 (close exactly at the low — maximum selling pressure), with 0 at the midpoint. Multiplying CLV by volume produces a signed directional contribution per bar: delta_raw = clv × volume. This is more nuanced than the binary tick rule (close > open = buy) used by most "delta" indicators — CLV captures HOW DECISIVELY price closed in its range, not just the sign.
The per-bar delta is then smoothed by EMA and normalized into a bounded 0-100 zero-centered score:
cvd_smooth = EMA(delta_raw, smoothing_length)
max_abs = highest(|cvd_smooth|, normalization_window)
score = 50 + (cvd_smooth / max_abs) × 50 [clamped 0-100]
The genius of the zero-centered approach: 50 always means balance, regardless of the asset's structural bias. A score of 75 means buyers are exerting 50% of the maximum recent pressure to the upside; a score of 25 means sellers are exerting 50% of maximum recent pressure to the downside. This is fundamentally different from a percentile rank (which would anchor 50 at the historical median, skewing with structural trends).
Five such scores — one per timeframe (default 5 / 15 / 60 / 240 / D) — are fused via canonical Fibonacci weights (0.15 / 0.20 / 0.25 / 0.25 / 0.15, peak weight on the macro TF3/TF4 where institutional positioning consolidates) into the weighted Master Line.
FEATURES
🔹 Multi-Timeframe CVD Fusion Engine (zero-centered directional scale)
🔹 CVD Histogram (deviation from neutral 50 — green buy / red sell)
🔹 Adaptive Fibonacci Channel (Z-Breathing → Z-Alert → Z-Exhaustion → Black Swan)
🔹 Hybrid Black Swan Zones (static or dynamic — default dynamic)
🔹 Classic Price↔CVD Divergence Detection (per-TF + Master)
🔹 MTF Legend Table (7 columns × 9 rows, with Raw Flow + State, multilingual)
🔹 Multilingual Interface (EN / PT / ES / RU / ZH)
🔹 Multi-Timeframe CVD Fusion Engine
What It Does
Runs five independent CVD scores on Fibonacci-spaced timeframes and fuses them into a single weighted Master Line, with each per-TF reading plotted as a ghost line that fades by distance to the consensus.
Method
On each timeframe, f_cvd_full() computes CLV × volume per bar, smooths it via EMA, and normalizes against a rolling-max window to produce the zero-centered score. The five scores fuse via Fibonacci weights (0.15 / 0.20 / 0.25 / 0.25 / 0.15). Both smoothing length and normalization window are independently configurable per timeframe.
Per-TF smoothing defaults (Wilder-anchored on TF3+TF4):
◇ TF1 (5m): 7 — scalping
◇ TF2 (15m): 10 — day-trading
◇ TF3 (60m): 14 — Wilder canonical
◇ TF4 (240m): 14 — Wilder canonical
◇ TF5 (D): 21 — swing/position
Per-TF normalization windows (each TF's natural horizon):
◇ TF1: 30 (≈2.5h on 5m)
◇ TF2: 50 (≈12.5h on 15m)
◇ TF3: 80 (≈3.3 days on 1h)
◇ TF4: 100 (≈16 days on 4h)
◇ TF5: 150 (≈5 months on Daily)
All request.security calls use lookahead=barmerge.lookahead_off for anti-repaint integrity.
Why It Matters
A 5-minute buy surge means little if the 4-hour and daily flows are decisively selling. The fusion engine reveals whether directional pressure is aligned across timescales (high conviction) or contradictory (a counter-trend bounce inside a larger trend). The ghost-line rainbow makes that alignment visible at a glance.
🔹 Adaptive Fibonacci Channel
What It Does
Six color-coded bands around the Master Line that adapt to its own recent volatility, using the brand's canonical Fibonacci ratios.
Method
Highest/lowest of the Master over a configurable lookback (default 50) are smoothed by EMA (default 10) to form the channel envelope. Bands sit at canonical Fibonacci proportions: Z-Breathing (1.50/1.85), Z-Alert (1.85σ anchor), Z-Exhaustion (2.75/1.85), Black Swan (3.85/1.85). All six band values are mathematically clamped to [0,100] before rendering, keeping the rainbow inside the visible pane.
Why It Matters
Static thresholds can't adapt to regime changes. The Fibonacci channel calibrates the warning zones to the asset's current directional-flow volatility, so a "climax" on a calm pair and a "climax" on a volatile one both trigger at appropriate statistical extremes.
🔹 Hybrid Black Swan Zones
What It Does
Flags directional flow climax extremes — either at static 85/15 thresholds (BUY CLIMAX / SELL CLIMAX boundaries) or at the dynamic Fibonacci 3.85σ band.
Method
Dynamic Black Swan Mode is ON by default (Fibonacci 3.85σ proportion of the Master channel). Toggle OFF for static 85/15. Each zone renders as a glow line that brightens as the Master approaches. The static reference lines (15/50/85) are shown by default to anchor the zero-centered scale: 85 = purple (buy climax boundary), 50 = yellow (neutral), 15 = aqua (sell climax boundary).
Why It Matters
Directional flow climaxes mark exhaustion points — a BUY CLIMAX (score ≥ 85) means buyers have pushed to a recent extreme, often preceding a pause or reversal; a SELL CLIMAX (≤ 15) marks capitulation. The dynamic mode self-calibrates per asset and regime.
🔹 Classic Price↔CVD Divergence Detection
What It Does
Detects regular bear divergences (price higher high while CVD makes lower high — rally on weakening buy pressure) and bull divergences (price lower low while CVD makes higher low — selling exhausting). Runs on each timeframe AND on the Master line.
Method
Per-TF divergence runs inside request.security via pivot detection on the per-TF CVD score. Master divergence runs on the chart-TF directly, rendering a connecting line + label between pivots (red bear / green bull) on the pane. Per-TF results surface in the Legend Table's "Div" column.
Why It Matters
Price↔flow divergence is one of the most powerful applications of CVD. When price makes a new high but directional flow doesn't confirm, the rally is running on fading conviction — a classic distribution warning. Detecting this per-TF AND on the Master gives both early granular warnings and high-conviction confirmations.
🔹 MTF Legend Table
What It Does
A compact 7×9 table surfacing every dimension of the analysis at a glance.
Method
Rendered via table.new(force_overlay=false) on the pane. Layout:
◇ Row 0: title (spans all columns)
◇ Row 1: column headers — Indicator / Timeframe / Value / Trend / Div / Raw / State
◇ Rows 2-6: per-TF data
◇ Row 7: Master row ("🌈 Master (~XhYm)" with effective TF)
◇ Row 8: MTF Divergence status row
Per-TF cells show: ● TF label (+ antenna 📡 if chart-native), TF resolution, zero-centered score (zone-colored), trend arrow (±0.5 deadzone), divergence (🔺/🔻/—), Raw Flow (compact K/M/B signed magnitude, green if positive / red if negative), and State (directional name, zone-colored).
Why It Matters
The Raw Flow column complements the Value column: Value answers "how strong is the directional pressure?" (the normalized score), while Raw answers "how much actual volume is behind it?" (the absolute flow). A score of 75 with a small raw magnitude is weaker conviction than 75 with a huge raw magnitude. Together with State, the table tells a complete directional story per timeframe.
🔹 Multilingual Interface
What It Does
Translates all HUD labels, status messages, alert text, Legend Table headers, and directional State names to 5 languages: English, Português, Español, Русский, 中文.
Method
A single language dropdown selects the active language via Pine v6's ternary-chain pattern. Code, comments, and configuration tooltips remain in English by convention.
Why It Matters
The Rainbow Matrix family is built for traders worldwide. Multilingual UI removes friction for non-English-native users.
HOW TO USE
Reading the Pane
◇ Master near 50 with ghost lines tight: balanced flow, no directional edge (absorption / equilibrium).
◇ Master rising above 50: buyers gaining control. Above 62 = BUY PRESSURE; above 71 = STRONG BUY.
◇ Master falling below 50: sellers gaining control. Below 38 = SELL PRESSURE; below 29 = STRONG SELL.
◇ Master touches Black Swan High (≥85, purple glow): BUY CLIMAX — buyers at a recent extreme, watch for exhaustion.
◇ Master touches Black Swan Low (≤15, aqua glow): SELL CLIMAX — capitulation, watch for reversal.
◇ Histogram green/red columns: immediate bar-by-bar directional read around the 50 centerline.
Reading the Legend Table
The antenna marker (📡) flags your chart's native timeframe — start there, then scan up/down to see whether faster/slower TFs confirm or contradict the directional bias. Compare Value (pressure strength), Raw (actual flow magnitude), and State (named classification) for each row. The status row summarizes MTF alignment between TF1 and TF5.
Reading Divergences
Master bear divergence (price up + CVD down) = rally on fading buy conviction, distribution warning. Master bull divergence (price down + CVD up) = selling exhausting, potential bottom. Per-TF divergences in the Div column give early granular warnings.
Tactical Combinations
◇ Master BUY CLIMAX + bear divergence + multiple TFs diverging = strongest reversal-from-high signal.
◇ Master SELL CLIMAX + bull divergence = strongest reversal-from-low signal.
◇ Master near 50 + all TFs near 50 + tight ghosts = absorption / coiling, often precedes a directional break.
◇ Triple confluence (the full family): RSI overbought + Volume EXTREME magnitude + CVD STRONG SELL = distribution at the top. RSI oversold + Volume EXTREME + CVD STRONG BUY = accumulation at the bottom. These three indicators answering momentum + magnitude + direction simultaneously is the strongest read the Rainbow Matrix family offers.
INPUTS EXPLAINED
GLOBAL SETTINGS — System Language (EN/PT/ES/RU/ZH), table/label font sizes.
MULTI-TIMEFRAME — AI Auto-Sync TFs; TF1-TF5 manual resolutions (default 5/15/60/240/D); per-TF CVD Smoothing Length (7/10/14/14/21); per-TF CVD Normalization Window (30/50/80/100/150).
ENGINE — Dynamic Black Swan Mode (default ON); Dynamic Channel Lookback (50) and Smoothing (10); Divergence Pivot Lookback (5).
VISUALIZATION — TF1-TF5 colors + show toggles (all ghost lines OFF by default — only Master visible on install); Ghost Fade Sensitivity (3.5); Show Master Line / Rainbow Fills / Black Swan / Dynamic Channel; Show CVD Histogram; Show MTF Legend Table; Show Divergence Column; Show Raw Flow Column; Show State Column; Show Master Divergence Chart Line; Legend position; Show Divergence Event Markers; Show Static Reference Lines (15/50/85, ON by default).
ALERTS — Black Swan crossings (high/low); Strong MTF Divergence; Z-Exhaustion zone entries; Master Classic Divergence.
IMPORTANT NOTES
🔸 Pine Script v6 — uses request.security with lookahead=barmerge.lookahead_off. 16 total security calls (5 CVD score + 5 per-TF divergence + supporting channel calculations). Chart load may take a moment longer than a single-TF indicator.
🔸 CLV approximation, not order-flow tick data — Directional pressure is approximated via the Close Location Value (where price closed within each bar's range), NOT real bid/ask order flow. Pine Script v6 has no tick-by-tick data access in indicator scripts. CLV is a more nuanced approximation than the binary tick rule used by most free-tier "delta" indicators, but it remains an approximation. For true order-flow delta, use dedicated footprint/order-flow tools.
🔸 Zero-centered scale — Unlike the percentile-rank siblings (RSI, Volume Delta Bar), this indicator's 50 is a TRUE neutral (zero net directional flow), not a historical median. This is intentional — direction is inherently signed, so a fixed zero-point is more meaningful than a regime-relative median.
🔸 Normalization warmup — During the first normalization_window bars on each TF, the rolling-max anchor (max_abs) is built from a small sample, so early bars may show exaggerated swings until the window fills. Normal warmup behavior for any rolling-window indicator.
🔸 Repaint behavior — Historical bars use confirmed close data; the current real-time bar updates as ticks arrive. Pivot-based divergence requires confirmation bars before triggering (standard pivot divergence behavior).
🔸 Fibonacci ratios are canonical — The channel proportions (1.50/1.85/2.75/3.85) and fusion weights (0.15/0.20/0.25/0.25/0.15) match the Rainbow Matrix brand standard across all sibling indicators, preserving cross-indicator visual consistency.
🔸 License: MPL 2.0 — open source. Free to fork, modify, and republish under the same license terms.
UNIQUENESS
Three pillars differentiate this from other CVD indicators on TradingView:
1. Multi-timeframe CVD fusion with synchrony as a visual property. Most CVD tools run on a single timeframe. This indicator runs five, fuses them via Fibonacci weights, and expresses directional alignment as a rainbow density — solid when timeframes agree on direction, spread when they disagree. The cross-TF directional consensus becomes immediately readable.
2. True zero-centered scale with CLV weighting. The 50 midpoint is a mathematically meaningful neutral (zero net flow), not a regime-skewed median. And the directional weighting uses Close Location Value — capturing how decisively price closed within each bar's range — rather than the cruder binary tick rule. This combination produces a directional read that stays honest across structural trends.
3. Three complementary readings in one Legend Table, designed as a family. Value (pressure strength), Raw Flow (actual magnitude), and State (named classification) disambiguate a single timeframe's directional picture. And as the directional member of the Rainbow Matrix trio (alongside RSI for momentum and Volume Delta Bar for magnitude), it completes a three-dimensional read of any market: where price is, how big the move is, and who's winning.
Rainbow Matrix AI | Multi-timeframe institutional analysis tools for traders.
🌐 rainbowmatrix.ai
✉️ Contact: contact@rainbowmatrix.ai
Скрипт с открытым кодом
В истинном духе TradingView, создатель этого скрипта сделал его открытым исходным кодом, чтобы трейдеры могли проверить и убедиться в его функциональности. Браво автору! Вы можете использовать его бесплатно, но помните, что перепубликация кода подчиняется нашим Правилам поведения.

Rainbow Matrix AI - Multi-timeframe institutional analysis tools.
rainbowmatrix.ai
rainbowmatrix.ai
Отказ от ответственности
Информация и публикации не предназначены для предоставления и не являются финансовыми, инвестиционными, торговыми или другими видами советов или рекомендаций, предоставленных или одобренных TradingView. Подробнее читайте в Условиях использования.
Скрипт с открытым кодом
В истинном духе TradingView, создатель этого скрипта сделал его открытым исходным кодом, чтобы трейдеры могли проверить и убедиться в его функциональности. Браво автору! Вы можете использовать его бесплатно, но помните, что перепубликация кода подчиняется нашим Правилам поведения.
Rainbow Matrix AI - Multi-timeframe institutional analysis tools.
rainbowmatrix.ai
rainbowmatrix.ai
Отказ от ответственности
Информация и публикации не предназначены для предоставления и не являются финансовыми, инвестиционными, торговыми или другими видами советов или рекомендаций, предоставленных или одобренных TradingView. Подробнее читайте в Условиях использования.