OPEN-SOURCE SCRIPT
Omni
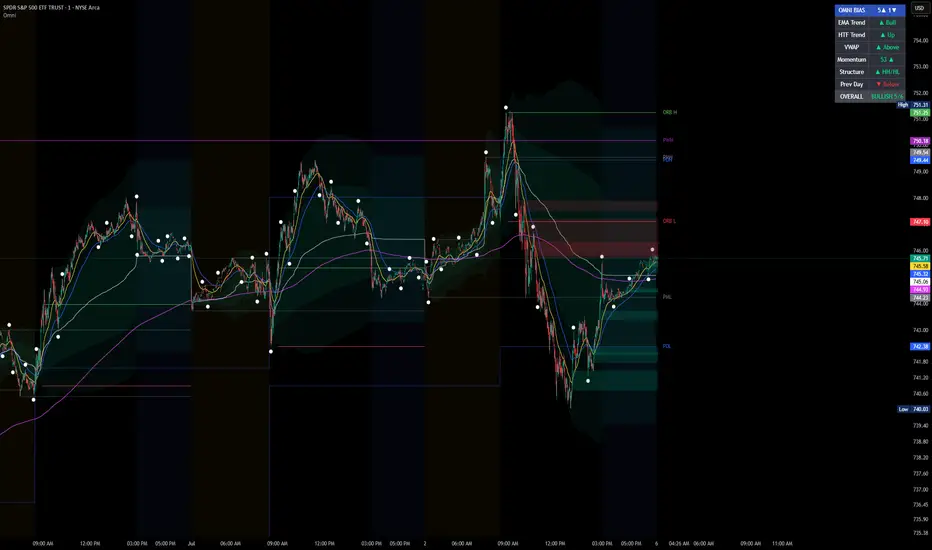
OMNI — All-in-One Price Action Toolkit
Omni combines six of the most-used intraday tools into a single indicator, so you don't need to stack five separate scripts to build a full picture of the market.
🔹 Hank Dot — Non-Repainting Swing Detection
Marks confirmed swing tops and bottoms with a dot, filtered by minimum swing size (ATR-based) so only meaningful turns get flagged. Fully non-repainting — a dot never moves or disappears once it prints, and it only appears after the turn is confirmed.
🔹 Fair Value Gaps (FVG) + Inverse FVG
Detects 3-candle imbalances on a higher timeframe of your choice and plots them as support/resistance zones directly on your chart. Broken zones can automatically flip color and role (support → resistance, or vice versa) when price closes through them.
🔹 VWAP with Standard Deviation Bands
Session VWAP with two configurable, shaded standard-deviation bands — useful for reading trend-day continuation zones vs. range-day extremes.
🔹 Multi-Timeframe EMAs
Three independently configurable EMAs, each with its own length and timeframe. Optional smoothing turns higher-timeframe EMAs into a gliding line instead of a stepped one.
🔹 Session & Liquidity Levels
Automatically plots Previous Day/Week High-Low, Pre-Market, Asian session, London session, and Opening Range Breakout (ORB) levels — with labels — so key liquidity zones are always visible.
🔹 Bias Table
A 6-factor dashboard (EMA trend, higher-timeframe trend, VWAP position, momentum, market structure, and prior-day position) that tallies into one bullish/bearish score at a glance.
Every input includes an in-depth tooltip explaining what it does and how it's typically used, so it's approachable whether you're new to these concepts or already familiar with them.
⚠️ This is an analysis tool, not financial advice. It is designed to help visualize price structure, liquidity, and confluence — always combine it with your own risk management and trade plan.
Omni combines six of the most-used intraday tools into a single indicator, so you don't need to stack five separate scripts to build a full picture of the market.
🔹 Hank Dot — Non-Repainting Swing Detection
Marks confirmed swing tops and bottoms with a dot, filtered by minimum swing size (ATR-based) so only meaningful turns get flagged. Fully non-repainting — a dot never moves or disappears once it prints, and it only appears after the turn is confirmed.
🔹 Fair Value Gaps (FVG) + Inverse FVG
Detects 3-candle imbalances on a higher timeframe of your choice and plots them as support/resistance zones directly on your chart. Broken zones can automatically flip color and role (support → resistance, or vice versa) when price closes through them.
🔹 VWAP with Standard Deviation Bands
Session VWAP with two configurable, shaded standard-deviation bands — useful for reading trend-day continuation zones vs. range-day extremes.
🔹 Multi-Timeframe EMAs
Three independently configurable EMAs, each with its own length and timeframe. Optional smoothing turns higher-timeframe EMAs into a gliding line instead of a stepped one.
🔹 Session & Liquidity Levels
Automatically plots Previous Day/Week High-Low, Pre-Market, Asian session, London session, and Opening Range Breakout (ORB) levels — with labels — so key liquidity zones are always visible.
🔹 Bias Table
A 6-factor dashboard (EMA trend, higher-timeframe trend, VWAP position, momentum, market structure, and prior-day position) that tallies into one bullish/bearish score at a glance.
Every input includes an in-depth tooltip explaining what it does and how it's typically used, so it's approachable whether you're new to these concepts or already familiar with them.
⚠️ This is an analysis tool, not financial advice. It is designed to help visualize price structure, liquidity, and confluence — always combine it with your own risk management and trade plan.
Скрипт с открытым кодом
В истинном духе TradingView, создатель этого скрипта сделал его открытым исходным кодом, чтобы трейдеры могли проверить и убедиться в его функциональности. Браво автору! Вы можете использовать его бесплатно, но помните, что перепубликация кода подчиняется нашим Правилам поведения.

Отказ от ответственности
Информация и публикации не предназначены для предоставления и не являются финансовыми, инвестиционными, торговыми или другими видами советов или рекомендаций, предоставленных или одобренных TradingView. Подробнее читайте в Условиях использования.
Скрипт с открытым кодом
В истинном духе TradingView, создатель этого скрипта сделал его открытым исходным кодом, чтобы трейдеры могли проверить и убедиться в его функциональности. Браво автору! Вы можете использовать его бесплатно, но помните, что перепубликация кода подчиняется нашим Правилам поведения.
Отказ от ответственности
Информация и публикации не предназначены для предоставления и не являются финансовыми, инвестиционными, торговыми или другими видами советов или рекомендаций, предоставленных или одобренных TradingView. Подробнее читайте в Условиях использования.