Liquidity MapZones [Quantum Edge]
BY QUANTUM EDGE: gLiquidity MapZones [Quantum Edge]
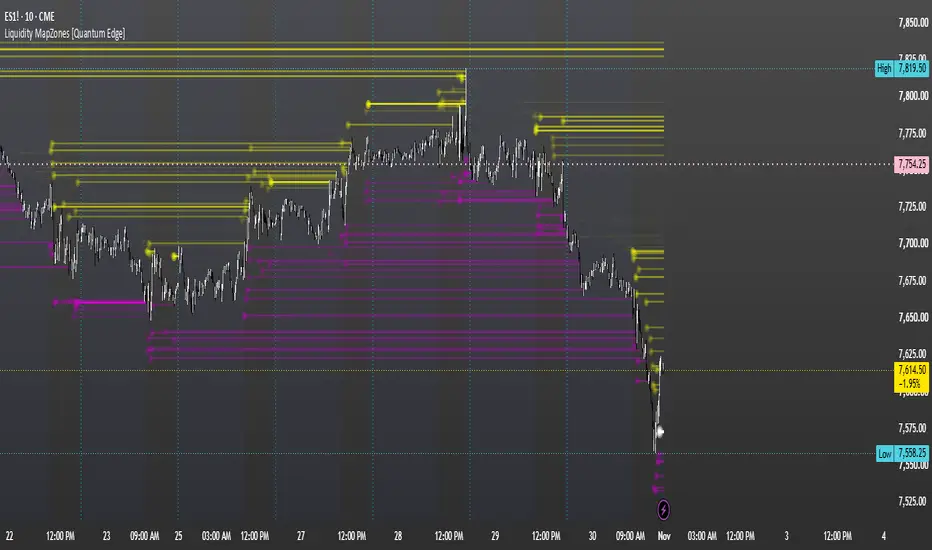
Liquidity MapZones [Quantum Edge] is a leverage-based overlay that projects hypothetical liquidation reference levels from above-average-volume candles. Horizontal lines, layered bubbles, and activity-weighted colors help visualize where these calculated levels form and how price subsequently interacts with them.
The indicator uses chart price and volume data—not exchange liquidation feeds, actual leveraged positions, or order-book information. Its plotted levels are mathematical reference prices, not verified liquidation clusters.
How it works
A candle qualifies when its volume exceeds the 14-period simple moving average of volume.
For qualifying candles:
Bullish candles create a hypothetical long-liquidation reference below the candle’s low.
Bearish candles create a hypothetical short-liquidation reference above the candle’s high.
Candles with identical opening and closing prices do not create directional levels.
The selected leverage determines the projected distance:
Long reference
=
Candle low
×
(
1
−
1
𝐿
)
Long reference=Candle low×(1−
L
1
)
Short reference
=
Candle high
×
(
1
+
1
𝐿
)
Short reference=Candle high×(1+
L
1
)
Here,
𝐿
L is the Leverage setting.
Higher leverage places levels closer to the candle extreme; lower leverage places them farther away. The setting ranges from 25 to 300, with a default of 300.
These calculations reference candle highs and lows, not actual trader entry prices.
HD and Normal modes
The display mode changes the activity score used for visual emphasis. It does not change the projected-price formulas.
HD: uses the qualifying candle’s full volume.
Normal: uses the qualifying candle’s volume minus the preceding candle’s volume.
Both modes require current volume to exceed its 14-period average. In Normal mode, the activity score can still be negative if current volume is lower than the previous candle’s volume.
HD does not add higher-resolution market data or verify liquidation accuracy.
Activity-weighted visuals
Each qualifying activity score is compared with the script’s rolling collection of stored scores.
Color intensity reflects the score’s position between the stored minimum and maximum.
Scores above the stored average receive thicker lines and an additional bubble layer.
Scores equal to the stored maximum receive the peak-highlight color, the thickest line, and the largest bubble layer.
Bubbles are drawn using overlapping circle plots. Their visual size represents activity categories, not a measured dollar amount of liquidations.
The activity-score collection includes qualifying candles regardless of the Long or Short display selection.
Horizontal level tracking
Projected lines extend forward until a candle’s range strictly crosses their price:
High
>
Level
and
Low
<
Level
High>LevelandLow<Level
Once this happens, the line stops extending but remains on the chart until removed by the rolling drawing limit.
An exact touch does not satisfy this condition. A gap entirely beyond a level also does not satisfy it unless a candle’s range spans the level.
A stopped line indicates a price-range crossing—not confirmation that real positions were liquidated.
Settings
Mode: selects HD full-volume scoring or Normal volume-change scoring.
Direction: displays Both, Long, or Short projections.
Leverage: controls the projected distance from candle extremes.
Long Color: customizes long-reference visuals.
Short Color: customizes short-reference visuals.
Peak Color: highlights events matching the maximum stored activity score.
Display Liquidation Bubbles: shows or hides bubble plots.
Display Liquidation Levels: shows or hides horizontal reference lines.
Intended use
Use the display to organize hypothetical leverage-sensitive reference prices around above-average-volume candles.
It can help highlight nearby groups of projected levels, compare the relative activity associated with their creation, and observe whether price later crosses them. It does not aggregate those levels into a measured liquidation-exposure map.
A level or cluster is contextual information—not a standalone entry, reversal, or continuation signal.
Important limitations
Calculations are not restricted to confirmed candle closes. Current-bar signals, projected prices, and visual emphasis can change before the candle closes.
The volume average includes the current candle.
The leverage value is a user-selected assumption, not observed market positioning.
Projections do not account for maintenance margin, fees, collateral, cross-margin exposure, or exchange-specific liquidation rules.
The script does not use open interest, position sizes, liquidation transactions, or actual account entry prices.
It does not confirm liquidity sweeps, reclaims, displacement, retests, or SMT.
No dedicated alerts, strategy orders, position sizing, or backtest statistics are included.
For educational and analytical use only. Projected levels do not verify actual liquidations, institutional positioning, or future price direction.g
Liquidity MapZones [Quantum Edge] is a leverage-based overlay that projects hypothetical liquidation reference levels from above-average-volume candles. Horizontal lines, layered bubbles, and activity-weighted colors help visualize where these calculated levels form and how price subsequently interacts with them.
The indicator uses chart price and volume data—not exchange liquidation feeds, actual leveraged positions, or order-book information. Its plotted levels are mathematical reference prices, not verified liquidation clusters.
How it works
A candle qualifies when its volume exceeds the 14-period simple moving average of volume.
For qualifying candles:
Bullish candles create a hypothetical long-liquidation reference below the candle’s low.
Bearish candles create a hypothetical short-liquidation reference above the candle’s high.
Candles with identical opening and closing prices do not create directional levels.
The selected leverage determines the projected distance:
Long reference
=
Candle low
×
(
1
−
1
𝐿
)
Long reference=Candle low×(1−
L
1
)
Short reference
=
Candle high
×
(
1
+
1
𝐿
)
Short reference=Candle high×(1+
L
1
)
Here,
𝐿
L is the Leverage setting.
Higher leverage places levels closer to the candle extreme; lower leverage places them farther away. The setting ranges from 25 to 300, with a default of 300.
These calculations reference candle highs and lows, not actual trader entry prices.
HD and Normal modes
The display mode changes the activity score used for visual emphasis. It does not change the projected-price formulas.
HD: uses the qualifying candle’s full volume.
Normal: uses the qualifying candle’s volume minus the preceding candle’s volume.
Both modes require current volume to exceed its 14-period average. In Normal mode, the activity score can still be negative if current volume is lower than the previous candle’s volume.
HD does not add higher-resolution market data or verify liquidation accuracy.
Activity-weighted visuals
Each qualifying activity score is compared with the script’s rolling collection of stored scores.
Color intensity reflects the score’s position between the stored minimum and maximum.
Scores above the stored average receive thicker lines and an additional bubble layer.
Scores equal to the stored maximum receive the peak-highlight color, the thickest line, and the largest bubble layer.
Bubbles are drawn using overlapping circle plots. Their visual size represents activity categories, not a measured dollar amount of liquidations.
The activity-score collection includes qualifying candles regardless of the Long or Short display selection.
Horizontal level tracking
Projected lines extend forward until a candle’s range strictly crosses their price:
High
>
Level
and
Low
<
Level
High>LevelandLow<Level
Once this happens, the line stops extending but remains on the chart until removed by the rolling drawing limit.
An exact touch does not satisfy this condition. A gap entirely beyond a level also does not satisfy it unless a candle’s range spans the level.
A stopped line indicates a price-range crossing—not confirmation that real positions were liquidated.
Settings
Mode: selects HD full-volume scoring or Normal volume-change scoring.
Direction: displays Both, Long, or Short projections.
Leverage: controls the projected distance from candle extremes.
Long Color: customizes long-reference visuals.
Short Color: customizes short-reference visuals.
Peak Color: highlights events matching the maximum stored activity score.
Display Liquidation Bubbles: shows or hides bubble plots.
Display Liquidation Levels: shows or hides horizontal reference lines.
Intended use
Use the display to organize hypothetical leverage-sensitive reference prices around above-average-volume candles.
It can help highlight nearby groups of projected levels, compare the relative activity associated with their creation, and observe whether price later crosses them. It does not aggregate those levels into a measured liquidation-exposure map.
A level or cluster is contextual information—not a standalone entry, reversal, or continuation signal.
Important limitations
Calculations are not restricted to confirmed candle closes. Current-bar signals, projected prices, and visual emphasis can change before the candle closes.
The volume average includes the current candle.
The leverage value is a user-selected assumption, not observed market positioning.
Projections do not account for maintenance margin, fees, collateral, cross-margin exposure, or exchange-specific liquidation rules.
The script does not use open interest, position sizes, liquidation transactions, or actual account entry prices.
It does not confirm liquidity sweeps, reclaims, displacement, retests, or SMT.
No dedicated alerts, strategy orders, position sizing, or backtest statistics are included.
For educational and analytical use only. Projected levels do not verify actual liquidations, institutional positioning, or future price direction.g

Отказ от ответственности
Информация и публикации не предназначены для предоставления и не являются финансовыми, инвестиционными, торговыми или другими видами советов или рекомендаций, предоставленных или одобренных TradingView. Подробнее читайте в Условиях использования.
Отказ от ответственности
Информация и публикации не предназначены для предоставления и не являются финансовыми, инвестиционными, торговыми или другими видами советов или рекомендаций, предоставленных или одобренных TradingView. Подробнее читайте в Условиях использования.