Volume Pulse & Average - CK
Short Description:
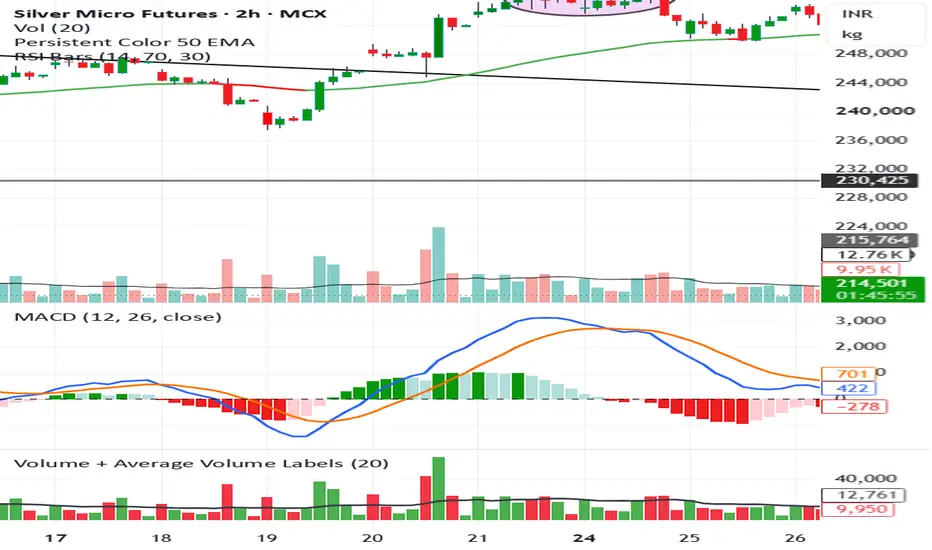
Volume Pulse is a simple volume analysis indicator that visually distinguishes bullish and bearish candle volume while tracking the 20-period average volume.
Full Description:
Volume Pulse & Average is a volume analysis tool designed to help traders quickly assess trading activity and compare current volume against its moving average.
Key Features:
🟢 Bullish Volume: Green columns represent volume on bullish candles.
🔴 Bearish Volume: Red columns represent volume on bearish candles.
⚫ Average Volume Line: A black moving-average line displays the average volume over the selected period.
Volume Labels: Displays individual candle volume values directly on the volume bars.
Average Volume Labels: Shows the corresponding average-volume values for quick comparison.
Customizable Settings: Adjust the moving-average period and enable or disable labels as needed.
How to Use:
Compare each candle's volume with the average-volume line to identify periods of relatively high or low trading activity. Observe whether increasing volume accompanies bullish or bearish price movement for additional market context.
Disclaimer: This indicator is intended for technical analysis and educational purposes only. Volume alone does not guarantee price direction or a profitable trade. Use it alongside price action and your trading strategy.
Author's Note: A straightforward volume visualization tool designed for traders who prefer a clean, color-coded view of market participation.
Volume Pulse is a simple volume analysis indicator that visually distinguishes bullish and bearish candle volume while tracking the 20-period average volume.
Full Description:
Volume Pulse & Average is a volume analysis tool designed to help traders quickly assess trading activity and compare current volume against its moving average.
Key Features:
🟢 Bullish Volume: Green columns represent volume on bullish candles.
🔴 Bearish Volume: Red columns represent volume on bearish candles.
⚫ Average Volume Line: A black moving-average line displays the average volume over the selected period.
Volume Labels: Displays individual candle volume values directly on the volume bars.
Average Volume Labels: Shows the corresponding average-volume values for quick comparison.
Customizable Settings: Adjust the moving-average period and enable or disable labels as needed.
How to Use:
Compare each candle's volume with the average-volume line to identify periods of relatively high or low trading activity. Observe whether increasing volume accompanies bullish or bearish price movement for additional market context.
Disclaimer: This indicator is intended for technical analysis and educational purposes only. Volume alone does not guarantee price direction or a profitable trade. Use it alongside price action and your trading strategy.
Author's Note: A straightforward volume visualization tool designed for traders who prefer a clean, color-coded view of market participation.

Отказ от ответственности
Информация и публикации не предназначены для предоставления и не являются финансовыми, инвестиционными, торговыми или другими видами советов или рекомендаций, предоставленных или одобренных TradingView. Подробнее читайте в Условиях использования.
Отказ от ответственности
Информация и публикации не предназначены для предоставления и не являются финансовыми, инвестиционными, торговыми или другими видами советов или рекомендаций, предоставленных или одобренных TradingView. Подробнее читайте в Условиях использования.