Fractal Dimension Oscillator [JOAT]
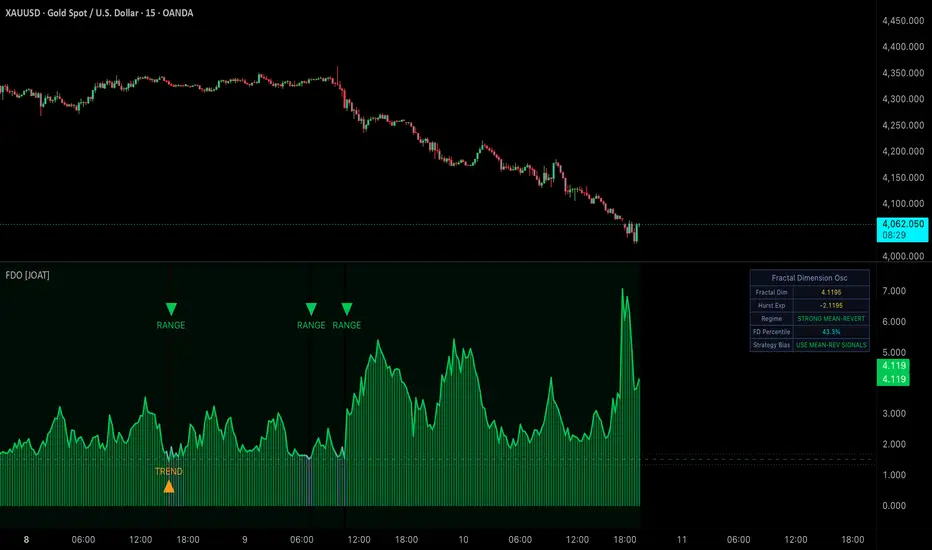
Fractal Dimension Oscillator [JOAT]
Introduction
Fractal Dimension Oscillator is an open-source market geometry classifier that computes the fractal dimension of a price series using the Katz method and derives the Hurst exponent from it. The fractal dimension measures how much a price series fills space — a perfectly straight line has dimension 1.0, while a completely random walk approaches 2.0. Values between these extremes encode whether price is behaving in a trending, random, or mean-reverting fashion at the current moment.
The Hurst exponent H is derived as H = 2 - FD. Values above 0.5 indicate persistent trending behavior; values below 0.5 indicate mean-reverting behavior; H near 0.5 indicates a random walk. This gives traders an analytically grounded way to distinguish market regimes that directly determines which type of strategy applies.
Core Concepts
1. Katz Fractal Dimension Method
The Katz method computes fractal dimension from the total path length of price movements divided by the maximum distance traveled from the starting point:
Pine Script®
This is computationally efficient compared to methods requiring fractal level decomposition and produces stable results across the configurable lookback period. The formula ensures that as price moves more linearly (large L relative to d), FD approaches 1.0. As price moves chaotically (small d despite large L), FD approaches 2.0.
2. Five-State Regime Classification
The raw FD value maps to five regime states based on configurable thresholds. The default boundaries are: Strong Trend (FD < 1.33), Trending (1.33–1.45), Random Walk (1.45–1.55), Mean-Reverting (1.55–1.67), Strong Mean-Revert (FD > 1.67). Each state carries a distinct color and strategy implication.

3. FD Percentile Tracking
The current FD value is ranked against a 100-bar rolling window to produce a percentile score. This shows not only the current regime state but how extreme that reading is relative to recent history — a 95th percentile trending reading is more significant than a borderline one.
4. Candle and Background Coloring
Candles are painted using a gradient: amber/gold for trending states, neutral for random walk, teal/cyan for mean-reverting states. Chart background is tinted faintly in the corresponding regime color. Both color channels update in real time as FD changes.
Features
Input Parameters
Fractal Engine:
Thresholds:
How to Use This Indicator
Step 1: Read the Strategy Bias
The dashboard's Strategy Bias row gives a direct instruction: USE TREND SIGNALS, USE MEAN-REV SIGNALS, or AVOID / WAIT. This summarizes the regime into an actionable filter.
Step 2: Use Regime Transitions as Mode Switches
When a TREND triangle appears after a period of RANGE, consider activating trend-following setups. When a RANGE transition appears after trend, consider rotating to mean-reversion approaches.
Step 3: Check the Percentile
A 90th-percentile trending reading suggests a particularly directional market. A 10th-percentile trending reading is borderline — apply less conviction to trend signals.
Indicator Limitations
Originality Statement
The Katz fractal dimension method is applied here in a complete regime classification engine with five states, EMA smoothing, a 100-bar percentile ranking, gradient candle coloring, and a strategy bias recommendation layer — none of which are standard in simple FD implementations. The combination of Hurst exponent derivation, percentile context, and strategy bias output in a single publication distinguishes this from generic fractal dimension scripts.
Disclaimer
This indicator is provided for educational and informational purposes only. It is not financial advice. Fractal dimension values describe historical price geometry and do not predict future price movement. Trading involves substantial risk of loss.
-Made with passion by jackofalltrades
Introduction
Fractal Dimension Oscillator is an open-source market geometry classifier that computes the fractal dimension of a price series using the Katz method and derives the Hurst exponent from it. The fractal dimension measures how much a price series fills space — a perfectly straight line has dimension 1.0, while a completely random walk approaches 2.0. Values between these extremes encode whether price is behaving in a trending, random, or mean-reverting fashion at the current moment.
The Hurst exponent H is derived as H = 2 - FD. Values above 0.5 indicate persistent trending behavior; values below 0.5 indicate mean-reverting behavior; H near 0.5 indicates a random walk. This gives traders an analytically grounded way to distinguish market regimes that directly determines which type of strategy applies.
Core Concepts
1. Katz Fractal Dimension Method
The Katz method computes fractal dimension from the total path length of price movements divided by the maximum distance traveled from the starting point:
This is computationally efficient compared to methods requiring fractal level decomposition and produces stable results across the configurable lookback period. The formula ensures that as price moves more linearly (large L relative to d), FD approaches 1.0. As price moves chaotically (small d despite large L), FD approaches 2.0.
2. Five-State Regime Classification
The raw FD value maps to five regime states based on configurable thresholds. The default boundaries are: Strong Trend (FD < 1.33), Trending (1.33–1.45), Random Walk (1.45–1.55), Mean-Reverting (1.55–1.67), Strong Mean-Revert (FD > 1.67). Each state carries a distinct color and strategy implication.
3. FD Percentile Tracking
The current FD value is ranked against a 100-bar rolling window to produce a percentile score. This shows not only the current regime state but how extreme that reading is relative to recent history — a 95th percentile trending reading is more significant than a borderline one.
4. Candle and Background Coloring
Candles are painted using a gradient: amber/gold for trending states, neutral for random walk, teal/cyan for mean-reverting states. Chart background is tinted faintly in the corresponding regime color. Both color channels update in real time as FD changes.
Features
- Katz fractal dimension calculation: Computationally efficient geometric method
- Hurst exponent display: H = 2 - FD, shown alongside raw FD in dashboard
- Five-state regime classification: Strong Trend through Strong Mean-Revert
- Smoothed EMA overlay: Optional EMA of raw FD for noise reduction
- Regime transition markers: On-chart triangle shapes at every regime change
- FD percentile (100-bar): Shows how extreme the current reading is historically
- Gradient candle coloring: Amber for trend, teal for mean-revert, neutral center
- Regime background tinting: Chart background reflects current regime state
- Dashboard: FD, Hurst, regime, percentile, and strategy bias recommendation
- Five alert conditions: Regime transitions and extreme readings
Input Parameters
Fractal Engine:
- Fractal Period: Lookback bars for FD calculation (default: 30, range: 10-200)
- EMA Smoothing: Smoothing period for the display line (default: 5)
Thresholds:
- Trending Threshold: Hurst value above which market is trending (default: 1.5)
- Mean-Revert Threshold: Hurst value above which market is strongly mean-reverting (default: 1.6)
How to Use This Indicator
Step 1: Read the Strategy Bias
The dashboard's Strategy Bias row gives a direct instruction: USE TREND SIGNALS, USE MEAN-REV SIGNALS, or AVOID / WAIT. This summarizes the regime into an actionable filter.
Step 2: Use Regime Transitions as Mode Switches
When a TREND triangle appears after a period of RANGE, consider activating trend-following setups. When a RANGE transition appears after trend, consider rotating to mean-reversion approaches.
Step 3: Check the Percentile
A 90th-percentile trending reading suggests a particularly directional market. A 10th-percentile trending reading is borderline — apply less conviction to trend signals.
Indicator Limitations
- Fractal dimension is a mathematical property of the price series, not a predictive indicator — it describes what has happened, not what will happen
- The Katz method is one of several FD estimation approaches; results will differ from Higuchi or other methods
- Short lookback periods produce noisier FD values; longer periods produce smoother but slower-responding readings
Originality Statement
The Katz fractal dimension method is applied here in a complete regime classification engine with five states, EMA smoothing, a 100-bar percentile ranking, gradient candle coloring, and a strategy bias recommendation layer — none of which are standard in simple FD implementations. The combination of Hurst exponent derivation, percentile context, and strategy bias output in a single publication distinguishes this from generic fractal dimension scripts.
Disclaimer
This indicator is provided for educational and informational purposes only. It is not financial advice. Fractal dimension values describe historical price geometry and do not predict future price movement. Trading involves substantial risk of loss.
-Made with passion by jackofalltrades

The Institutional Grade Trading Ecosystem, Built to win trades 📈
Get Access 👇
jackofalltrades.vip 🌐
t.me/jackofalltradesvip 🃏
Get Access 👇
jackofalltrades.vip 🌐
t.me/jackofalltradesvip 🃏
Отказ от ответственности
Информация и публикации не предназначены для предоставления и не являются финансовыми, инвестиционными, торговыми или другими видами советов или рекомендаций, предоставленных или одобренных TradingView. Подробнее читайте в Условиях использования.
The Institutional Grade Trading Ecosystem, Built to win trades 📈
Get Access 👇
jackofalltrades.vip 🌐
t.me/jackofalltradesvip 🃏
Get Access 👇
jackofalltrades.vip 🌐
t.me/jackofalltradesvip 🃏
Отказ от ответственности
Информация и публикации не предназначены для предоставления и не являются финансовыми, инвестиционными, торговыми или другими видами советов или рекомендаций, предоставленных или одобренных TradingView. Подробнее читайте в Условиях использования.