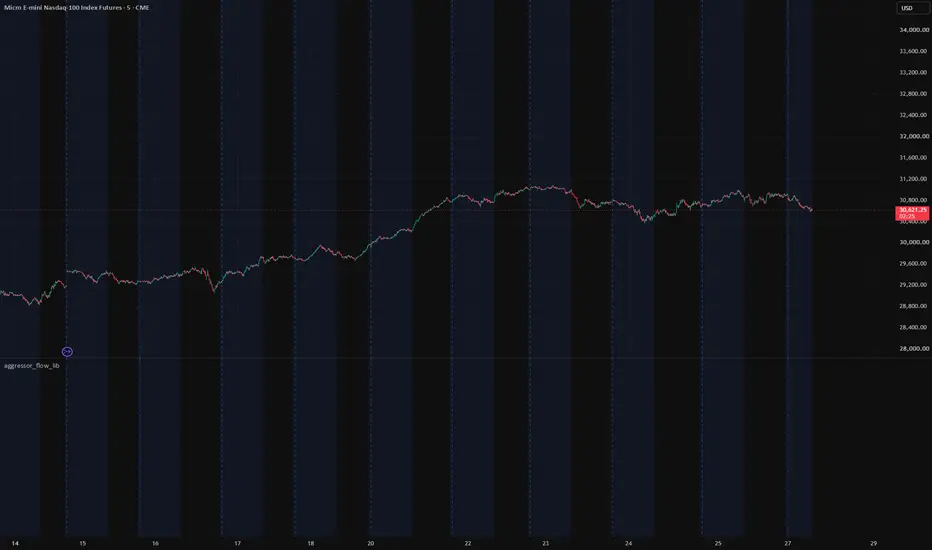
aggressor_flow_lib
📘 ABOUT THIS LIBRARY
Aggressor Flow is an order-flow engine for Pine Script. It turns each chart bar's volume footprint -- buy and sell volume at every price row -- into a small, fixed vocabulary of named events that any indicator or strategy can use as confluence: who was aggressing, whether that aggression achieved anything, where the heavy volume sat, and what happened when price came back to a level you care about.
It is the engine behind the Aggressor Volume Delta indicator, published separately as a library so other scripts can run exactly the same logic.
✍️ ORIGINALITY
This library is the author's original work. It contains no third-party code. It is built only on Pine built-ins: the footprint and volume_row types returned by request.footprint(), arrays supplied from request.security_lower_tf(), and the standard ta.* and math.* functions.
⚙️ HOW IT WORKS
Two engines, one shape
Every read in the library works from one object, BarFlow, which either of two engines can fill:
fromFootprint() reads the platform's volume footprint for the bar. Your script makes the request.footprint() call and passes the result in -- the library never calls it, so importing the library never uses up your script's single footprint request, and a script without footprint access can still import it.
fromSubBars() builds an approximate footprint from 1-second sub-bars, classifying each by the tick rule and binning it by its close. It works without footprint access, but it is coarser: a sub-bar that traded at several prices books all its volume to its last one.
Because both engines fill the same object, every signal, zone and hook below is computed by identical code whichever source you use.
Bar signals
classify() turns one bar into named signals, each with a bullish and bearish side (even ids bullish, odd bearish):
Absorption (0/1) -- one side made a real effort and it was soaked up. Effort is bar delta as a z-score against its own recent history. The library fits, over a rolling window, how far price normally moves per unit of delta on this instrument, and measures the bar's actual move as a fraction of that expected move. The effort counts as absorbed when price travelled only a small fraction of the normal distance, or moved against the aggressor.
Exhaustion (2/3) -- a new swing extreme printed on a thin extreme row, with delta fading against the previous bars.
Continuation (4/5) -- stacked imbalances with strong delta, a close near the bar's extreme and a close beyond the prior bar.
Trapped traders (6/7) -- a heavily one-sided bar makes a new swing extreme, and the very next bar closes beyond that bar's opposite extreme, leaving the aggressors offside.
Delta flip (8/9) -- the first bar of meaningful delta after a run of opposite bars.
Zones and zone events
Absorption, stacked imbalances and single heavy rows create price zones. Each bar tests existing zones before adding new ones, and reports defended (10/11), reclaimed after a breach (12/13), breached (14/15) and heavy level held on a repeat defence (16/17). A breach that is not reclaimed in time flips the zone's polarity.
Scorecard
The library can score every signal against what price did next: from the signal bar's close, does price reach a target of N ATRs in the signal's direction before a stop of N ATRs against it, within a set number of bars? Every bar is also scored both ways as a baseline, and results are split into the early and late half of the loaded history -- so a signal's hit rate can be compared with the rate any bar would have achieved, and a setting chosen on one half can be checked on the other.
🎯 HOOKS — THE FOOTPRINT AT YOUR OWN LEVELS
Level hooks
Most scripts already know which prices matter to them: a range high, an opening-range edge, a session level. The level hooks let you ask the footprint a specific question at such a level.
levelRead(flow, level, side, config) is stateless. For one bar and one level it reports whether the bar touched, held or broke the level; how far price went through it in ticks; the share of the bar's volume traded beyond it; the share of the volume at the level that was aggression into it; the heaviest row at the level against the bar's median row; and the bar's delta signed toward the defending side. It also names two reads: failed break (aggressors pushed through, volume traded beyond the level, and price closed back -- they are offside) and absorbed (heavy aggression into the level, and it held).
LevelWatch is stateful. Point it at a level with setLevel() and call update() on every confirmed bar. It tracks fresh touches, the touch count, holds, breaks, and the first retest after a break -- including whether the retest bar's delta pointed in the break direction.
Trade-management hooks
stopBehind(flow, dir, padTicks) returns a stop placed behind the row that did the absorbing on the bar: below the heaviest selling row for a long, above the heaviest buying row for a short.
opposingStack(flow, dir, minStack) is true when the bar printed a stacked imbalance against a position -- a cue to exit or tighten.
Event masks
signalMask() and levelMask() pack events into a single number, and maskHas() reads a bit back. A script can plot a mask and another script on the chart can read it through input.source(), so one footprint request can serve several scripts.
🧩 HOW TO USE IT
Pine Script®
Rules that matter
⚠️ LIMITATIONS
📜 DISCLAIMER
This library is published for educational and research purposes. It is not financial advice, and it does not guarantee any trading result. Past behaviour of any signal does not predict future results. Trading futures and other leveraged instruments carries substantial risk of loss. You are solely responsible for how you use it.
Aggressor Flow is an order-flow engine for Pine Script. It turns each chart bar's volume footprint -- buy and sell volume at every price row -- into a small, fixed vocabulary of named events that any indicator or strategy can use as confluence: who was aggressing, whether that aggression achieved anything, where the heavy volume sat, and what happened when price came back to a level you care about.
It is the engine behind the Aggressor Volume Delta indicator, published separately as a library so other scripts can run exactly the same logic.
✍️ ORIGINALITY
This library is the author's original work. It contains no third-party code. It is built only on Pine built-ins: the footprint and volume_row types returned by request.footprint(), arrays supplied from request.security_lower_tf(), and the standard ta.* and math.* functions.
⚙️ HOW IT WORKS
Two engines, one shape
Every read in the library works from one object, BarFlow, which either of two engines can fill:
fromFootprint() reads the platform's volume footprint for the bar. Your script makes the request.footprint() call and passes the result in -- the library never calls it, so importing the library never uses up your script's single footprint request, and a script without footprint access can still import it.
fromSubBars() builds an approximate footprint from 1-second sub-bars, classifying each by the tick rule and binning it by its close. It works without footprint access, but it is coarser: a sub-bar that traded at several prices books all its volume to its last one.
Because both engines fill the same object, every signal, zone and hook below is computed by identical code whichever source you use.
Bar signals
classify() turns one bar into named signals, each with a bullish and bearish side (even ids bullish, odd bearish):
Absorption (0/1) -- one side made a real effort and it was soaked up. Effort is bar delta as a z-score against its own recent history. The library fits, over a rolling window, how far price normally moves per unit of delta on this instrument, and measures the bar's actual move as a fraction of that expected move. The effort counts as absorbed when price travelled only a small fraction of the normal distance, or moved against the aggressor.
Exhaustion (2/3) -- a new swing extreme printed on a thin extreme row, with delta fading against the previous bars.
Continuation (4/5) -- stacked imbalances with strong delta, a close near the bar's extreme and a close beyond the prior bar.
Trapped traders (6/7) -- a heavily one-sided bar makes a new swing extreme, and the very next bar closes beyond that bar's opposite extreme, leaving the aggressors offside.
Delta flip (8/9) -- the first bar of meaningful delta after a run of opposite bars.
Zones and zone events
Absorption, stacked imbalances and single heavy rows create price zones. Each bar tests existing zones before adding new ones, and reports defended (10/11), reclaimed after a breach (12/13), breached (14/15) and heavy level held on a repeat defence (16/17). A breach that is not reclaimed in time flips the zone's polarity.
Scorecard
The library can score every signal against what price did next: from the signal bar's close, does price reach a target of N ATRs in the signal's direction before a stop of N ATRs against it, within a set number of bars? Every bar is also scored both ways as a baseline, and results are split into the early and late half of the loaded history -- so a signal's hit rate can be compared with the rate any bar would have achieved, and a setting chosen on one half can be checked on the other.
🎯 HOOKS — THE FOOTPRINT AT YOUR OWN LEVELS
Level hooks
Most scripts already know which prices matter to them: a range high, an opening-range edge, a session level. The level hooks let you ask the footprint a specific question at such a level.
levelRead(flow, level, side, config) is stateless. For one bar and one level it reports whether the bar touched, held or broke the level; how far price went through it in ticks; the share of the bar's volume traded beyond it; the share of the volume at the level that was aggression into it; the heaviest row at the level against the bar's median row; and the bar's delta signed toward the defending side. It also names two reads: failed break (aggressors pushed through, volume traded beyond the level, and price closed back -- they are offside) and absorbed (heavy aggression into the level, and it held).
LevelWatch is stateful. Point it at a level with setLevel() and call update() on every confirmed bar. It tracks fresh touches, the touch count, holds, breaks, and the first retest after a break -- including whether the retest bar's delta pointed in the break direction.
Trade-management hooks
stopBehind(flow, dir, padTicks) returns a stop placed behind the row that did the absorbing on the bar: below the heaviest selling row for a long, above the heaviest buying row for a short.
opposingStack(flow, dir, minStack) is true when the bar printed a stacked imbalance against a position -- a cue to exit or tighten.
Event masks
signalMask() and levelMask() pack events into a single number, and maskHas() reads a bit back. A script can plot a mask and another script on the chart can read it through input.source(), so one footprint request can serve several scripts.
🧩 HOW TO USE IT
Rules that matter
- Call classify() on every bar at global scope. It keeps rolling statistics that corrupt if a bar is skipped.
- Call LevelWatch.update() on every confirmed bar. It keeps its own previous close and touch state.
- LevelWatch is for step levels that hold still for a while. Changing the level resets the watch, so for a level that moves every bar (such as a session average price), use levelRead() with approachSide(level, close[1]), taking close[1] at global scope.
- Act on confirmed bars. The footprint of the live bar keeps changing until it closes.
- Every threshold lives in the Config and LevelConfig types, so your script builds them from its own inputs.
⚠️ LIMITATIONS
- The footprint's buy/sell split is an approximation of the aggressor side: the platform classifies each intrabar by comparing its close with its open. It is not an exchange aggressor flag.
- request.footprint() reads the chart symbol only, and needs a plan with footprint access. Older bars are rebuilt from coarser intrabars, so a bar's historical footprint can differ from what it showed live, and a long backtest reads a coarser footprint than live trading does.
- The sub-bar engine needs second-resolution data, and its imbalance flags are this library's own.
- Nothing in Pine can see the order book, so no script can detect an iceberg order. The heavy-level-held events show only the traded side of one -- a price absorbing outsized volume again and again -- which is equally consistent with ordinary resting orders.
- repeatPrints() looks for identical trade sizes repeating at one price and needs trade-level input; whether tick data is served through request.security_lower_tf() is not verified.
- The signals, level reads and trade-management hooks are confluence inputs, not a trading system. None of them is presented as predictive on its own. Test any use of them in your own script's backtest before relying on it.
📜 DISCLAIMER
This library is published for educational and research purposes. It is not financial advice, and it does not guarantee any trading result. Past behaviour of any signal does not predict future results. Trading futures and other leveraged instruments carries substantial risk of loss. You are solely responsible for how you use it.

Отказ от ответственности
Информация и публикации не предназначены для предоставления и не являются финансовыми, инвестиционными, торговыми или другими видами советов или рекомендаций, предоставленных или одобренных TradingView. Подробнее читайте в Условиях использования.
Отказ от ответственности
Информация и публикации не предназначены для предоставления и не являются финансовыми, инвестиционными, торговыми или другими видами советов или рекомендаций, предоставленных или одобренных TradingView. Подробнее читайте в Условиях использования.