OPEN-SOURCE SCRIPT
Momentum RSI | NAL
1. Overview
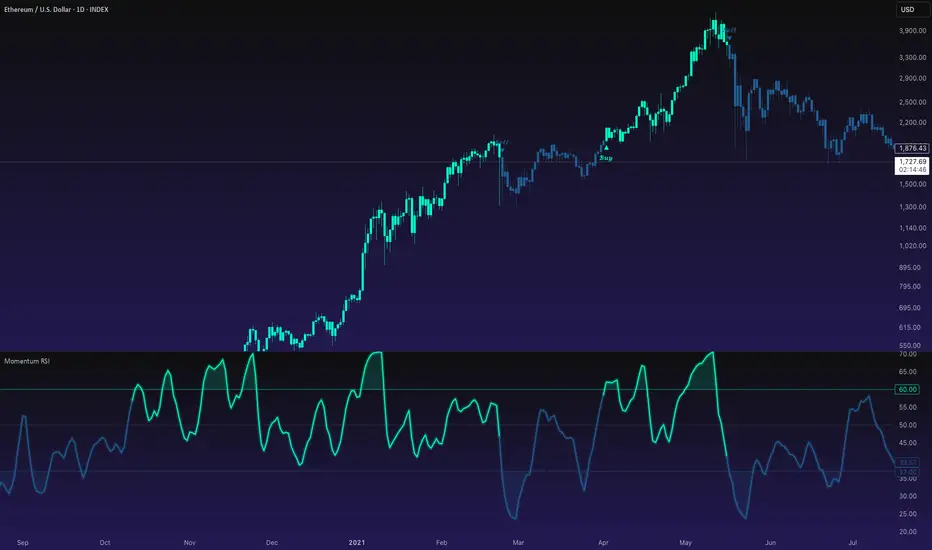
Momentum RSI | NAL is a momentum-regime indicator built around a Jurik-smoothed double RSI engine. It first smooths price using a Jurik-style moving average, then applies RSI twice to measure both momentum and momentum-of-momentum.
Instead of relying on raw RSI movement, the indicator uses a smoothed second RSI layer to better identify when momentum is expanding or deteriorating. The final Momentum RSI is compared against bullish and bearish thresholds to create a clean directional state.
2. Calculation
The indicator starts by smoothing the selected source with a Jurik-style moving average. This creates a cleaner input before the RSI calculation, helping reduce noise while keeping the response relatively fast.
The first RSI measures the momentum of the smoothed source. The second RSI is then applied to the first RSI, creating a double RSI structure. This second layer measures whether the original RSI itself is strengthening or weakening.
After the double RSI is calculated, it is smoothed again using the same Jurik-style smoothing method. This produces the final Momentum RSI line.
The signal is based on two thresholds. A bullish state triggers when the Momentum RSI rises above the long threshold. A bearish state triggers when the Momentum RSI falls below the short threshold.
When the Momentum RSI is between both thresholds, the indicator keeps its previous directional state. This helps avoid constant neutral flipping and gives a cleaner regime-style output.
3. Key Features
4. Use
Works well for identifying momentum shifts and potential exhaustion areas during trending periods. The double RSI structure can react to changes in momentum before a standard RSI fully confirms the move.
A move above the long threshold suggests bullish momentum pressure. A move below the short threshold suggests bearish momentum pressure. The colored candles and transition labels make it easier to see when the indicator changes state.
Best used in confluence with other indicators, due to its unique behavior and potential for false signals in choppy or low-directional regimes. The indicator is best used as a momentum-regime tool for confirming trend continuation, spotting momentum deterioration, and visually separating bullish and bearish conditions.
Momentum RSI | NAL is a momentum-regime indicator built around a Jurik-smoothed double RSI engine. It first smooths price using a Jurik-style moving average, then applies RSI twice to measure both momentum and momentum-of-momentum.
Instead of relying on raw RSI movement, the indicator uses a smoothed second RSI layer to better identify when momentum is expanding or deteriorating. The final Momentum RSI is compared against bullish and bearish thresholds to create a clean directional state.
2. Calculation
The indicator starts by smoothing the selected source with a Jurik-style moving average. This creates a cleaner input before the RSI calculation, helping reduce noise while keeping the response relatively fast.
The first RSI measures the momentum of the smoothed source. The second RSI is then applied to the first RSI, creating a double RSI structure. This second layer measures whether the original RSI itself is strengthening or weakening.
After the double RSI is calculated, it is smoothed again using the same Jurik-style smoothing method. This produces the final Momentum RSI line.
The signal is based on two thresholds. A bullish state triggers when the Momentum RSI rises above the long threshold. A bearish state triggers when the Momentum RSI falls below the short threshold.
When the Momentum RSI is between both thresholds, the indicator keeps its previous directional state. This helps avoid constant neutral flipping and gives a cleaner regime-style output.
3. Key Features
- Jurik-smoothed double RSI momentum engine.
- Measures both momentum and momentum-of-momentum.
- Bullish and bearish threshold-based regime detection.
- State-based coloring that holds the previous direction between thresholds.
- Glow-style RSI plot, threshold fills, candle coloring, and transition labels.
4. Use
Works well for identifying momentum shifts and potential exhaustion areas during trending periods. The double RSI structure can react to changes in momentum before a standard RSI fully confirms the move.
A move above the long threshold suggests bullish momentum pressure. A move below the short threshold suggests bearish momentum pressure. The colored candles and transition labels make it easier to see when the indicator changes state.
Best used in confluence with other indicators, due to its unique behavior and potential for false signals in choppy or low-directional regimes. The indicator is best used as a momentum-regime tool for confirming trend continuation, spotting momentum deterioration, and visually separating bullish and bearish conditions.
Скрипт с открытым кодом
В истинном духе TradingView, создатель этого скрипта сделал его открытым исходным кодом, чтобы трейдеры могли проверить и убедиться в его функциональности. Браво автору! Вы можете использовать его бесплатно, но помните, что перепубликация кода подчиняется нашим Правилам поведения.

🔵 Access our best trading & investing tools, get a 30-day free trial today: whop.com/nordic-alpha-lab/
Отказ от ответственности
Информация и публикации не предназначены для предоставления и не являются финансовыми, инвестиционными, торговыми или другими видами советов или рекомендаций, предоставленных или одобренных TradingView. Подробнее читайте в Условиях использования.
Скрипт с открытым кодом
В истинном духе TradingView, создатель этого скрипта сделал его открытым исходным кодом, чтобы трейдеры могли проверить и убедиться в его функциональности. Браво автору! Вы можете использовать его бесплатно, но помните, что перепубликация кода подчиняется нашим Правилам поведения.
🔵 Access our best trading & investing tools, get a 30-day free trial today: whop.com/nordic-alpha-lab/
Отказ от ответственности
Информация и публикации не предназначены для предоставления и не являются финансовыми, инвестиционными, торговыми или другими видами советов или рекомендаций, предоставленных или одобренных TradingView. Подробнее читайте в Условиях использования.