RSI with Bollinger Bands
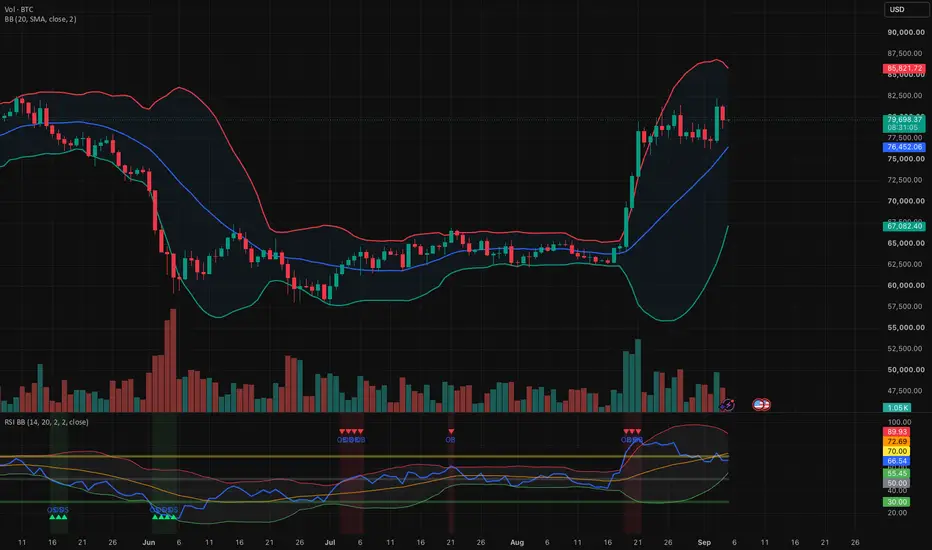
RSI with Bollinger Bands combines the Relative Strength Index with Bollinger Bands calculated directly on the RSI itself.
This indicator is designed to help identify periods when RSI momentum becomes unusually stretched relative to its recent behavior, instead of relying only on the traditional fixed 30 and 70 RSI levels.
The RSI is displayed together with a Bollinger Band basis, upper band, and lower band. When RSI moves outside the bands, the indicator can display overbought or oversold breach signals and highlight the background.
Features
RSI oscillator
Standard RSI calculation
Default RSI Length: 14
Adjustable price source
Bollinger Bands on RSI
Bollinger Bands are calculated from the RSI value
Default BB Length: 20
Default Upper Multiplier: 2.0
Default Lower Multiplier: 2.0
Upper and lower multipliers can be adjusted independently
Overbought Breach Signals
Displays an OB signal when RSI moves above the upper Bollinger Band
Red background highlighting can appear during the condition
Oversold Breach Signals
Displays an OS signal when RSI moves below the lower Bollinger Band
Green background highlighting can appear during the condition
Traditional RSI Reference Levels
70 level
50 level
30 level
These levels can be shown or hidden
Customizable Display
Show or hide breach signals
Show or hide the Bollinger Band fill
Show or hide the 30 / 50 / 70 RSI levels
Settings
Length
Controls the RSI calculation period.
Default: 14
BB Length
Controls the lookback period used to calculate the Bollinger Band basis and standard deviation on RSI.
Default: 20
BB Up
Controls the standard-deviation multiplier for the upper Bollinger Band.
Default: 2.0
BB Down
Controls the standard-deviation multiplier for the lower Bollinger Band.
Default: 2.0
Price Source
Selects the price source used for the RSI calculation.
Default: Close
Show Breach Signals
Turns the OB and OS markers on or off.
Fill Bands
Turns the shaded area between the upper and lower Bollinger Bands on or off.
Show RSI 30/50/70 Levels
Turns the traditional RSI reference levels on or off.
How to Read the Indicator
When RSI moves above the upper Bollinger Band, it means RSI is unusually strong relative to its recent range. This can indicate elevated bullish momentum or a potentially overextended condition.
When RSI moves below the lower Bollinger Band, it means RSI is unusually weak relative to its recent range. This can indicate elevated bearish momentum or a potentially oversold condition.
The traditional 30 and 70 RSI levels remain available as additional reference points.
Alerts
The indicator includes built-in alert conditions for:
RSI Above Upper Band
RSI Below Lower Band
These alerts can be used to notify you when RSI breaches either Bollinger Band.
Important
A breach of the upper or lower band should not automatically be treated as a reversal signal. Strong trends can keep RSI extended for a significant period.
This indicator is best used together with price action, trend analysis, support and resistance, volume, or other forms of confirmation.
For educational and informational purposes only. This indicator does not constitute financial advice.
This indicator is designed to help identify periods when RSI momentum becomes unusually stretched relative to its recent behavior, instead of relying only on the traditional fixed 30 and 70 RSI levels.
The RSI is displayed together with a Bollinger Band basis, upper band, and lower band. When RSI moves outside the bands, the indicator can display overbought or oversold breach signals and highlight the background.
Features
RSI oscillator
Standard RSI calculation
Default RSI Length: 14
Adjustable price source
Bollinger Bands on RSI
Bollinger Bands are calculated from the RSI value
Default BB Length: 20
Default Upper Multiplier: 2.0
Default Lower Multiplier: 2.0
Upper and lower multipliers can be adjusted independently
Overbought Breach Signals
Displays an OB signal when RSI moves above the upper Bollinger Band
Red background highlighting can appear during the condition
Oversold Breach Signals
Displays an OS signal when RSI moves below the lower Bollinger Band
Green background highlighting can appear during the condition
Traditional RSI Reference Levels
70 level
50 level
30 level
These levels can be shown or hidden
Customizable Display
Show or hide breach signals
Show or hide the Bollinger Band fill
Show or hide the 30 / 50 / 70 RSI levels
Settings
Length
Controls the RSI calculation period.
Default: 14
BB Length
Controls the lookback period used to calculate the Bollinger Band basis and standard deviation on RSI.
Default: 20
BB Up
Controls the standard-deviation multiplier for the upper Bollinger Band.
Default: 2.0
BB Down
Controls the standard-deviation multiplier for the lower Bollinger Band.
Default: 2.0
Price Source
Selects the price source used for the RSI calculation.
Default: Close
Show Breach Signals
Turns the OB and OS markers on or off.
Fill Bands
Turns the shaded area between the upper and lower Bollinger Bands on or off.
Show RSI 30/50/70 Levels
Turns the traditional RSI reference levels on or off.
How to Read the Indicator
When RSI moves above the upper Bollinger Band, it means RSI is unusually strong relative to its recent range. This can indicate elevated bullish momentum or a potentially overextended condition.
When RSI moves below the lower Bollinger Band, it means RSI is unusually weak relative to its recent range. This can indicate elevated bearish momentum or a potentially oversold condition.
The traditional 30 and 70 RSI levels remain available as additional reference points.
Alerts
The indicator includes built-in alert conditions for:
RSI Above Upper Band
RSI Below Lower Band
These alerts can be used to notify you when RSI breaches either Bollinger Band.
Important
A breach of the upper or lower band should not automatically be treated as a reversal signal. Strong trends can keep RSI extended for a significant period.
This indicator is best used together with price action, trend analysis, support and resistance, volume, or other forms of confirmation.
For educational and informational purposes only. This indicator does not constitute financial advice.

Отказ от ответственности
Информация и публикации не предназначены для предоставления и не являются финансовыми, инвестиционными, торговыми или другими видами советов или рекомендаций, предоставленных или одобренных TradingView. Подробнее читайте в Условиях использования.
Отказ от ответственности
Информация и публикации не предназначены для предоставления и не являются финансовыми, инвестиционными, торговыми или другими видами советов или рекомендаций, предоставленных или одобренных TradingView. Подробнее читайте в Условиях использования.