Dealer Gamma Exposure - Option Chain Input
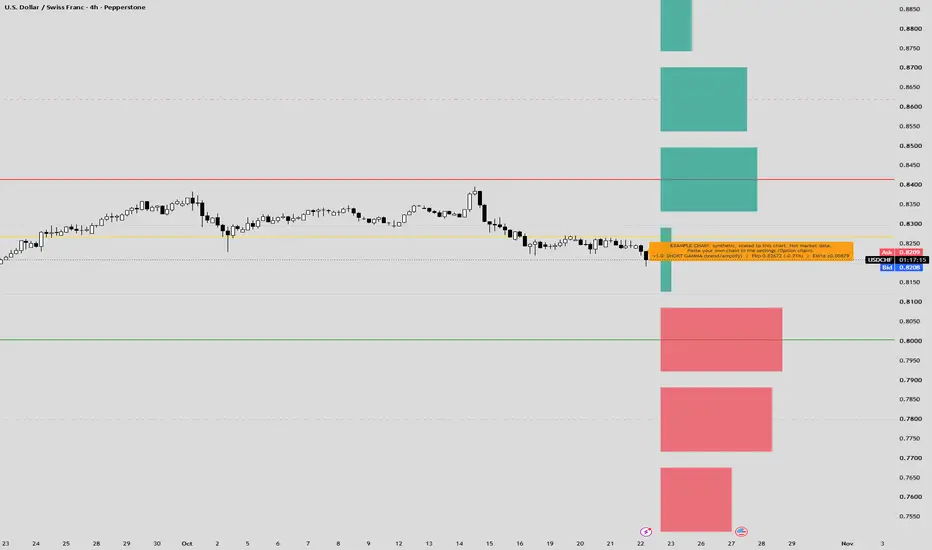
A dealer gamma exposure calculator that works on any chart: you paste an
option-chain snapshot into one settings field, and the script computes the
gamma exposure profile, the gamma flip, the call and put walls and the
expected move, and draws them next to price.
What makes it original: Pine cannot load option chains, so most gamma tools
ship hardcoded levels that go stale the day after publication. This script
contains the full calculation instead. The chain is user input, every level
is recomputed from it on your chart, and each row can carry its own implied
volatility and days to expiry, so chains that span several expiries are
priced correctly instead of on one averaged maturity.
How it works:
- Input format: a header line (#spot=...;dte=...;mult=...;iv=...;aiv=...;
date=...) followed by one line per strike: strike;callOI;putOI[;iv[;dte]].
The tooltip of the field documents every key. One market per instance;
add the indicator twice for two markets.
- Per row, Black-Scholes gamma (r = 0) is computed and signed with the usual
dealer convention (long call gamma, short put gamma), then aggregated per
strike into exposure per 1% move. The histogram shows positive exposure in
teal and negative in red.
- Gamma flip: the price where total exposure crosses zero, found by scanning
the strike range and refining around the crossing nearest to spot. Call and
put walls are the strikes with the largest positive and negative exposure,
with the second-largest shown dashed.
- Expected move: plus/minus one trading day from the ATM implied volatility
(aiv from the header if given, otherwise the median IV of the six rows
nearest to spot).
- The label shows the regime (long gamma above the flip, short gamma below,
a flip zone of adjustable width around it), net exposure and the expected
move; the chart background is tinted by regime. With a date= key, a warning
appears once the snapshot is more than 36 hours old.
- Optional second-order flows on the same chain: vanna (dealer delta change
per one volatility point) and charm (delta decay per trading day), as totals
in the label and as the dominant strike lines. They carry an extra caveat:
context, not signals.
- A chart offset shifts every level by a constant amount when your chart
(for example a CFD) trades at a basis to the option underlying.
- Alerts: flip crossed up or down, put wall broken or reclaimed, call wall
exceeded.
- Without your own chain the script runs on a built-in synthetic example,
rescaled to the chart price and clearly labeled as example data, so you see
what the output looks like. The example never triggers alerts and never
tints the background.
How to use it: take the chain of the underlying index from your broker or the
exchange once per day, paste it, and read the levels as context for where
dealer hedging changes character. Above the flip, hedging tends to dampen
moves and pin price toward large strikes; below it, hedging tends to amplify
moves. Walls often act as magnets or turning areas, and a broken put wall
marks the zone where amplification risk rises. A text field holds about
10,900 characters (roughly 400 to 500 rows). If your chain is longer, delete
the rows with the smallest open interest rather than the far strikes: on a
700-row index chain this kept the flip within one point, while cutting the far
strikes moved it by almost 90. All values are model estimates under the
stated sign convention.
option-chain snapshot into one settings field, and the script computes the
gamma exposure profile, the gamma flip, the call and put walls and the
expected move, and draws them next to price.
What makes it original: Pine cannot load option chains, so most gamma tools
ship hardcoded levels that go stale the day after publication. This script
contains the full calculation instead. The chain is user input, every level
is recomputed from it on your chart, and each row can carry its own implied
volatility and days to expiry, so chains that span several expiries are
priced correctly instead of on one averaged maturity.
How it works:
- Input format: a header line (#spot=...;dte=...;mult=...;iv=...;aiv=...;
date=...) followed by one line per strike: strike;callOI;putOI[;iv[;dte]].
The tooltip of the field documents every key. One market per instance;
add the indicator twice for two markets.
- Per row, Black-Scholes gamma (r = 0) is computed and signed with the usual
dealer convention (long call gamma, short put gamma), then aggregated per
strike into exposure per 1% move. The histogram shows positive exposure in
teal and negative in red.
- Gamma flip: the price where total exposure crosses zero, found by scanning
the strike range and refining around the crossing nearest to spot. Call and
put walls are the strikes with the largest positive and negative exposure,
with the second-largest shown dashed.
- Expected move: plus/minus one trading day from the ATM implied volatility
(aiv from the header if given, otherwise the median IV of the six rows
nearest to spot).
- The label shows the regime (long gamma above the flip, short gamma below,
a flip zone of adjustable width around it), net exposure and the expected
move; the chart background is tinted by regime. With a date= key, a warning
appears once the snapshot is more than 36 hours old.
- Optional second-order flows on the same chain: vanna (dealer delta change
per one volatility point) and charm (delta decay per trading day), as totals
in the label and as the dominant strike lines. They carry an extra caveat:
context, not signals.
- A chart offset shifts every level by a constant amount when your chart
(for example a CFD) trades at a basis to the option underlying.
- Alerts: flip crossed up or down, put wall broken or reclaimed, call wall
exceeded.
- Without your own chain the script runs on a built-in synthetic example,
rescaled to the chart price and clearly labeled as example data, so you see
what the output looks like. The example never triggers alerts and never
tints the background.
How to use it: take the chain of the underlying index from your broker or the
exchange once per day, paste it, and read the levels as context for where
dealer hedging changes character. Above the flip, hedging tends to dampen
moves and pin price toward large strikes; below it, hedging tends to amplify
moves. Walls often act as magnets or turning areas, and a broken put wall
marks the zone where amplification risk rises. A text field holds about
10,900 characters (roughly 400 to 500 rows). If your chain is longer, delete
the rows with the smallest open interest rather than the far strikes: on a
700-row index chain this kept the flip within one point, while cutting the far
strikes moved it by almost 90. All values are model estimates under the
stated sign convention.

Отказ от ответственности
Информация и публикации не предназначены для предоставления и не являются финансовыми, инвестиционными, торговыми или другими видами советов или рекомендаций, предоставленных или одобренных TradingView. Подробнее читайте в Условиях использования.
Отказ от ответственности
Информация и публикации не предназначены для предоставления и не являются финансовыми, инвестиционными, торговыми или другими видами советов или рекомендаций, предоставленных или одобренных TradingView. Подробнее читайте в Условиях использования.