Обновлено
ICT Setup Screener, Liquidity Sweep, MSS & FVG Scanner [LunqFX]
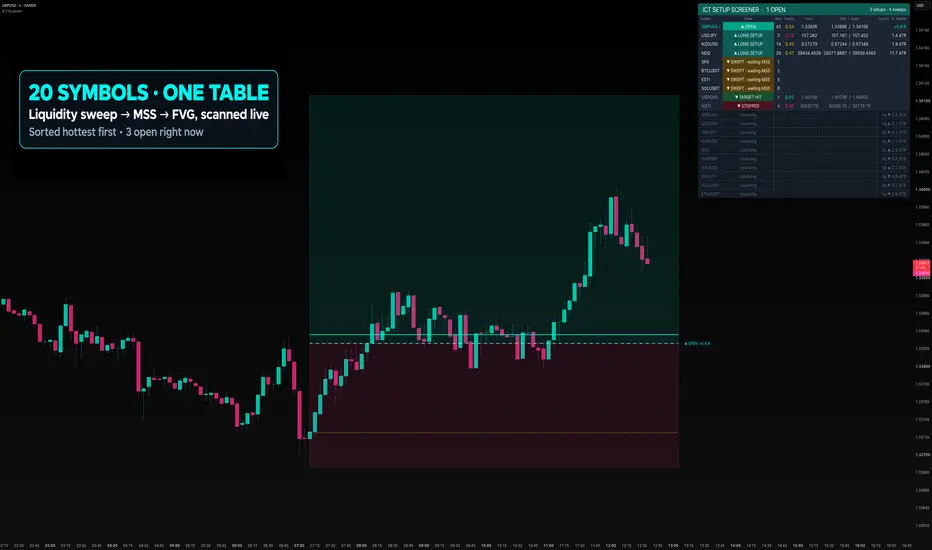
An ICT entry is not a signal. It is a sequence: liquidity gets swept, structure shifts the other way, the displacement leaves an imbalance, and price comes back to it. On one chart you watch one instrument walk through that sequence. This tool walks twenty instruments through it at the same time and ranks them by how far along each one is — so "where is a setup forming right now" is answered by one table instead of twenty tabs.
It is a screener first. The twenty instruments live in a table; the one chart you are looking at gets its own live stage drawn on the candles — the swept level, the shift level, the entry with stop and target — so the row marked ◂ and the chart agree, and the chart is never a bare table floating over price.
Included: twenty independent scanners running the same liquidity sweep → MSS → FVG model, a live-sorted table with the hottest rows on top, a 0–100 quality grade per setup, entry / stop / target per row, distance to entry in ATR before the entry and the trade's standing in R after it — the two units twenty different instruments share, a hero line summarising the whole list, and one alert per bar that names the symbol.
❶ THE TABLE

Every row is one symbol and one stage of the model:
SCANNING — nothing in progress. The row is not dead: its last column shows how far the nearest untaken liquidity sits, in ATR, with the direction — that is where the next sweep can come from. SWEPT · waiting MSS — a swing was run and price closed back inside. The row is amber. It stays here until structure shifts or the wait runs out. LONG SETUP / SHORT SETUP — the shift confirmed, the FVG left by the displacement is mapped, the row shows entry, stop, target, a quality grade and how many ATRs away from the entry price currently is. OPEN — price has returned into the imbalance and the trade is live. Brightest colour in the table, top of the list. The last column switches from distance-to-entry to how the trade stands in R, green above the entry, magenta below. TARGET HIT / STOPPED — how the last entry resolved. Held for a few bars, then the row returns to scanning. An open trade that touches neither within a set number of bars is retired the same way — the screener is for finding setups, not for babysitting a position for a week.
Rows are re-sorted on every bar: entries first, then mapped setups, then pending sweeps, then finished trades, then idle rows. Within a stage the freshest row wins. The symbol of the chart you are on is marked with ◂.
The hero line at the top reads the whole list at once: "2 OPEN", "3 SETUPS MAPPED", "1 SWEEP PENDING", or "NO SETUPS".
❷ QUALITY 0–100
Not every sequence is worth taking. Each mapped setup is graded on four things: how deep the sweep went beyond the swing, how strong the displacement through the shift level was, how large the imbalance is, and how quickly the shift followed the sweep — all measured against that instrument's own ATR, so a quiet pair and a volatile one are graded on the same scale. Quality 70 and above shows in turquoise, 45–69 in amber, below that in magenta. A minimum quality can be set so weaker setups never reach the table.
❸ THE MODEL, AND WHY THIS IS NOT THE SAME SCRIPT
The sequence is the one from my published, open-source ICT Entry Model, and I state that plainly rather than pretend a different rule was invented for this tool. What is different is the tool. The Entry Model is a chart overlay: it draws every setup one instrument produces, keeps several on screen, grades and tags them. The Screener runs the sequence as a state machine inside twenty separate data requests, one per symbol, and reports the stage of each in a ranked table. On the chart itself it draws only the CURRENT stage of the current symbol — six objects, redrawn every bar, no history — so that the ◂ row can be checked against the candles without opening another script. A trader uses the two together — the Screener to find which instrument is at the interesting stage, the Entry Model on that chart to see the setup — and a screener that scans a model nobody can see would be a black box. Both are open source so the sequence can be checked line for line.
The sequence, exactly:
Sweep — the low (or high) of a confirmed swing is traded through by the wick and the bar closes back inside the swing, while the internal structure level on the other side is still unbroken. Shift — within a limited number of bars, a close beyond that internal structure level. If it does not come, or if price first closes beyond the sweep's own extreme — the stops were run through rather than rejected — the sweep is discarded. Entry — the most recent three-bar imbalance inside the displacement leg. Its near edge is the entry; if no imbalance formed, the shift level is. Stop is the extreme of the sweep, target is your R multiple from the entry. A setup whose stop would be smaller than a fraction of ATR is rejected. Return — price trades into the entry within a limited number of bars, or the setup is dropped. A close through the stop before the entry is reached drops it as well. Resolution — stop or target is touched. If one bar spans both, it is counted as stopped: when the order of fills inside a bar is unknown, the honest reading is the loss.
❹ ALERTS
One alert per bar, listing every symbol that mapped a setup or reached its entry on that bar, with side and quality — "EURUSD long setup mapped Q72 · XAUUSD short entered". Create it as "Any alert() function call" on the script. Because the message carries the symbol, one alert covers the whole watchlist.
HOW TO USE IT
1 — Set the watchlist. Twenty symbol slots, defaults are forex majors, metals, crypto and index futures. Put in what you actually trade; a symbol your data plan cannot load shows as scanning forever.
2 — Fix the scan timeframe. Blank means the chart's timeframe, which is fine on one chart but changes the table every time you switch. Set 15 or 60 and the table reads the same wherever you open it.
3 — Read from the top. The list is sorted so the rows worth your attention are already first. OPEN means the entry has been reached and the trade is running. A setup showing "0.3 ATR" is close; "2.4 ATR" is not yet.
4 — Open the chart before you act. The row tells you the stage and the levels; the chart shows you the candles, and once you are on that symbol its stage is drawn there. Read the structure yourself and decide there.
5 — Raise the swing length for higher timeframes and lower the row count if you want a shorter table.
HOW IT WORKS
The entire model lives in one function. That function is passed to request.security once per symbol and once more for the chart itself, and because every call site keeps its own persistent state, the twenty calls are twenty independent state machines built from one body of code. Each returns its stage, direction, bars in stage, quality, entry, stop, target and one progress number: distance from the close to the entry in ATR while the setup is waiting, the trade's standing in R once it is open. On the last bar the twenty results are collected into arrays, ranked — stage first, then age — and drawn into the table in that order. Alerts are assembled from the same results: any row that changed stage on the closed bar is named in one message. Swings are confirmed pivots; every transition happens on a closed bar; the request is made with lookahead off.
LIMITATIONS — read before relying on it
▸ Twenty symbols is the ceiling. TradingView allows forty data requests per script; each symbol costs one and the chart's own run costs one more, twenty-one in all, which keeps the script fast. Rows in use can be lowered, not raised.
▸ It cannot show you the other nineteen charts. A row says "SHORT SETUP, Q68, 0.4 ATR to entry"; it does not say whether that sits under a daily level or into news. Only the chart you are on has its stage drawn. The table is for finding, the chart is for deciding.
▸ On a scan timeframe higher than the chart's, a row updates when that timeframe's bar closes. Until then it holds its last confirmed stage. That is the cost of not repainting.
▸ Prices in the table are printed with up to five decimals, not each instrument's tick size, because the script cannot know the tick size of nineteen other symbols. Read them as levels, not as order tickets.
▸ TARGET HIT and STOPPED are the last resolution of one row, held for a few bars. They are not tallied anywhere and should not be. A screener is not a backtest and this description makes no claim about how often the model wins.
▸ Sessions and holidays differ between instruments. A symbol whose market is closed sits at its last stage until it reopens; a futures roll can produce a gap that reads as a sweep.
▸ The quality grade is a heuristic built from four measurements. It ranks setups relative to each other; it is not a probability.
▸ Symbols are set by hand. There is no way for a script to scan a whole exchange; it scans the twenty you give it.
WHY IT IS ORIGINAL
There are chart-pattern screeners and multi-indicator screeners on TradingView. There is no screener that runs a full ICT entry sequence — sweep, shift, imbalance, return — as a state machine across a watchlist and ranks the instruments by stage. The originality is not in the sequence, which is published and credited above; it is in turning that sequence into something that can be run twenty times in parallel and read as one list. That required the model to be written as a single stateful function that carries nothing but numbers out of each data request, and a ranking that puts the rows in the order a trader would look at them.
SETTINGS
▸ Entry model — scan timeframe, liquidity swing length, internal structure length, max bars sweep → MSS, max bars setup → entry, max bars in trade, take profit in R, minimum stop distance in ATR, minimum quality. ▸ Watchlist — twenty symbols and the number of rows in use. ▸ Visuals — five candle palettes plus off, draw this chart's setup on or off, table position and text size, hide scanning rows, alerts on or off.
NON-REPAINTING — pivots are confirmed, every stage change happens on a closed bar, and every request is made with lookahead explicitly off. A row moves forward through the sequence and never back.
This indicator is an educational market-analysis tool, not financial advice. It reports where instruments stand in a defined sequence; it does not predict what any of them will do next. Always confirm on the chart, use your own analysis and manage your risk.
It is a screener first. The twenty instruments live in a table; the one chart you are looking at gets its own live stage drawn on the candles — the swept level, the shift level, the entry with stop and target — so the row marked ◂ and the chart agree, and the chart is never a bare table floating over price.
Included: twenty independent scanners running the same liquidity sweep → MSS → FVG model, a live-sorted table with the hottest rows on top, a 0–100 quality grade per setup, entry / stop / target per row, distance to entry in ATR before the entry and the trade's standing in R after it — the two units twenty different instruments share, a hero line summarising the whole list, and one alert per bar that names the symbol.
❶ THE TABLE
Every row is one symbol and one stage of the model:
SCANNING — nothing in progress. The row is not dead: its last column shows how far the nearest untaken liquidity sits, in ATR, with the direction — that is where the next sweep can come from. SWEPT · waiting MSS — a swing was run and price closed back inside. The row is amber. It stays here until structure shifts or the wait runs out. LONG SETUP / SHORT SETUP — the shift confirmed, the FVG left by the displacement is mapped, the row shows entry, stop, target, a quality grade and how many ATRs away from the entry price currently is. OPEN — price has returned into the imbalance and the trade is live. Brightest colour in the table, top of the list. The last column switches from distance-to-entry to how the trade stands in R, green above the entry, magenta below. TARGET HIT / STOPPED — how the last entry resolved. Held for a few bars, then the row returns to scanning. An open trade that touches neither within a set number of bars is retired the same way — the screener is for finding setups, not for babysitting a position for a week.
Rows are re-sorted on every bar: entries first, then mapped setups, then pending sweeps, then finished trades, then idle rows. Within a stage the freshest row wins. The symbol of the chart you are on is marked with ◂.
The hero line at the top reads the whole list at once: "2 OPEN", "3 SETUPS MAPPED", "1 SWEEP PENDING", or "NO SETUPS".
❷ QUALITY 0–100
Not every sequence is worth taking. Each mapped setup is graded on four things: how deep the sweep went beyond the swing, how strong the displacement through the shift level was, how large the imbalance is, and how quickly the shift followed the sweep — all measured against that instrument's own ATR, so a quiet pair and a volatile one are graded on the same scale. Quality 70 and above shows in turquoise, 45–69 in amber, below that in magenta. A minimum quality can be set so weaker setups never reach the table.
❸ THE MODEL, AND WHY THIS IS NOT THE SAME SCRIPT
The sequence is the one from my published, open-source ICT Entry Model, and I state that plainly rather than pretend a different rule was invented for this tool. What is different is the tool. The Entry Model is a chart overlay: it draws every setup one instrument produces, keeps several on screen, grades and tags them. The Screener runs the sequence as a state machine inside twenty separate data requests, one per symbol, and reports the stage of each in a ranked table. On the chart itself it draws only the CURRENT stage of the current symbol — six objects, redrawn every bar, no history — so that the ◂ row can be checked against the candles without opening another script. A trader uses the two together — the Screener to find which instrument is at the interesting stage, the Entry Model on that chart to see the setup — and a screener that scans a model nobody can see would be a black box. Both are open source so the sequence can be checked line for line.
The sequence, exactly:
Sweep — the low (or high) of a confirmed swing is traded through by the wick and the bar closes back inside the swing, while the internal structure level on the other side is still unbroken. Shift — within a limited number of bars, a close beyond that internal structure level. If it does not come, or if price first closes beyond the sweep's own extreme — the stops were run through rather than rejected — the sweep is discarded. Entry — the most recent three-bar imbalance inside the displacement leg. Its near edge is the entry; if no imbalance formed, the shift level is. Stop is the extreme of the sweep, target is your R multiple from the entry. A setup whose stop would be smaller than a fraction of ATR is rejected. Return — price trades into the entry within a limited number of bars, or the setup is dropped. A close through the stop before the entry is reached drops it as well. Resolution — stop or target is touched. If one bar spans both, it is counted as stopped: when the order of fills inside a bar is unknown, the honest reading is the loss.
❹ ALERTS
One alert per bar, listing every symbol that mapped a setup or reached its entry on that bar, with side and quality — "EURUSD long setup mapped Q72 · XAUUSD short entered". Create it as "Any alert() function call" on the script. Because the message carries the symbol, one alert covers the whole watchlist.
HOW TO USE IT
1 — Set the watchlist. Twenty symbol slots, defaults are forex majors, metals, crypto and index futures. Put in what you actually trade; a symbol your data plan cannot load shows as scanning forever.
2 — Fix the scan timeframe. Blank means the chart's timeframe, which is fine on one chart but changes the table every time you switch. Set 15 or 60 and the table reads the same wherever you open it.
3 — Read from the top. The list is sorted so the rows worth your attention are already first. OPEN means the entry has been reached and the trade is running. A setup showing "0.3 ATR" is close; "2.4 ATR" is not yet.
4 — Open the chart before you act. The row tells you the stage and the levels; the chart shows you the candles, and once you are on that symbol its stage is drawn there. Read the structure yourself and decide there.
5 — Raise the swing length for higher timeframes and lower the row count if you want a shorter table.
HOW IT WORKS
The entire model lives in one function. That function is passed to request.security once per symbol and once more for the chart itself, and because every call site keeps its own persistent state, the twenty calls are twenty independent state machines built from one body of code. Each returns its stage, direction, bars in stage, quality, entry, stop, target and one progress number: distance from the close to the entry in ATR while the setup is waiting, the trade's standing in R once it is open. On the last bar the twenty results are collected into arrays, ranked — stage first, then age — and drawn into the table in that order. Alerts are assembled from the same results: any row that changed stage on the closed bar is named in one message. Swings are confirmed pivots; every transition happens on a closed bar; the request is made with lookahead off.
LIMITATIONS — read before relying on it
▸ Twenty symbols is the ceiling. TradingView allows forty data requests per script; each symbol costs one and the chart's own run costs one more, twenty-one in all, which keeps the script fast. Rows in use can be lowered, not raised.
▸ It cannot show you the other nineteen charts. A row says "SHORT SETUP, Q68, 0.4 ATR to entry"; it does not say whether that sits under a daily level or into news. Only the chart you are on has its stage drawn. The table is for finding, the chart is for deciding.
▸ On a scan timeframe higher than the chart's, a row updates when that timeframe's bar closes. Until then it holds its last confirmed stage. That is the cost of not repainting.
▸ Prices in the table are printed with up to five decimals, not each instrument's tick size, because the script cannot know the tick size of nineteen other symbols. Read them as levels, not as order tickets.
▸ TARGET HIT and STOPPED are the last resolution of one row, held for a few bars. They are not tallied anywhere and should not be. A screener is not a backtest and this description makes no claim about how often the model wins.
▸ Sessions and holidays differ between instruments. A symbol whose market is closed sits at its last stage until it reopens; a futures roll can produce a gap that reads as a sweep.
▸ The quality grade is a heuristic built from four measurements. It ranks setups relative to each other; it is not a probability.
▸ Symbols are set by hand. There is no way for a script to scan a whole exchange; it scans the twenty you give it.
WHY IT IS ORIGINAL
There are chart-pattern screeners and multi-indicator screeners on TradingView. There is no screener that runs a full ICT entry sequence — sweep, shift, imbalance, return — as a state machine across a watchlist and ranks the instruments by stage. The originality is not in the sequence, which is published and credited above; it is in turning that sequence into something that can be run twenty times in parallel and read as one list. That required the model to be written as a single stateful function that carries nothing but numbers out of each data request, and a ranking that puts the rows in the order a trader would look at them.
SETTINGS
▸ Entry model — scan timeframe, liquidity swing length, internal structure length, max bars sweep → MSS, max bars setup → entry, max bars in trade, take profit in R, minimum stop distance in ATR, minimum quality. ▸ Watchlist — twenty symbols and the number of rows in use. ▸ Visuals — five candle palettes plus off, draw this chart's setup on or off, table position and text size, hide scanning rows, alerts on or off.
NON-REPAINTING — pivots are confirmed, every stage change happens on a closed bar, and every request is made with lookahead explicitly off. A row moves forward through the sequence and never back.
This indicator is an educational market-analysis tool, not financial advice. It reports where instruments stand in a defined sequence; it does not predict what any of them will do next. Always confirm on the chart, use your own analysis and manage your risk.
Информация о релизе
Added: optional sweep alert. "Also alert on sweep" (Settings → Visuals, on by default) sends an early heads-up when liquidity is swept on any scanned symbol, before the shift confirms, so you know which chart to open. Existing alerts must be re-created to receive it.
Trade setups with clear entry, stop, target and risk logic. Built for traders who want structure, not guessing.
💬 t.me/lunqfx
🌐 lunqfx.com/premium
💬 t.me/lunqfx
🌐 lunqfx.com/premium
Отказ от ответственности
Информация и публикации не предназначены для предоставления и не являются финансовыми, инвестиционными, торговыми или другими видами советов или рекомендаций, предоставленных или одобренных TradingView. Подробнее читайте в Условиях использования.
Trade setups with clear entry, stop, target and risk logic. Built for traders who want structure, not guessing.
💬 t.me/lunqfx
🌐 lunqfx.com/premium
💬 t.me/lunqfx
🌐 lunqfx.com/premium
Отказ от ответственности
Информация и публикации не предназначены для предоставления и не являются финансовыми, инвестиционными, торговыми или другими видами советов или рекомендаций, предоставленных или одобренных TradingView. Подробнее читайте в Условиях использования.