OPEN-SOURCE SCRIPT
Обновлено RSI StdDev Trend Breakout
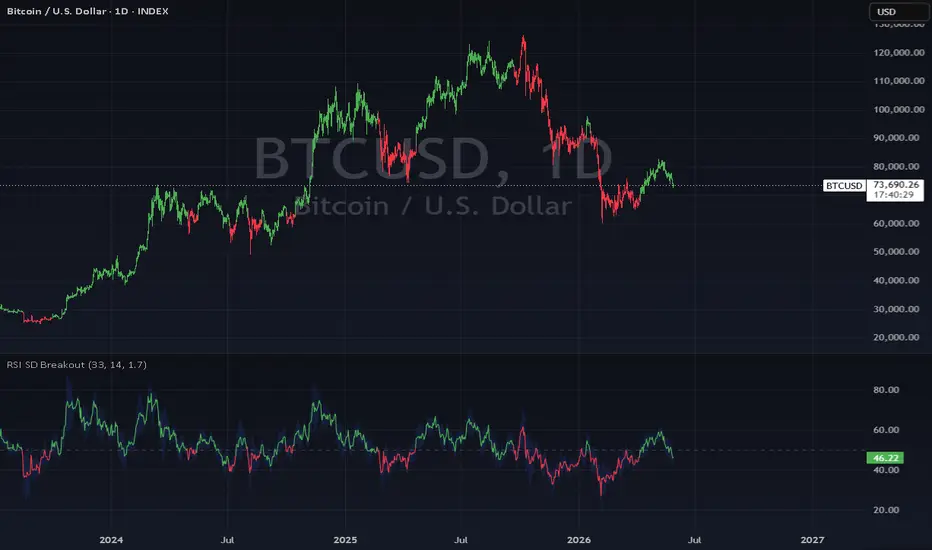
Overview
RSI StdDev Trend Breakout is a hybrid momentum and trend indicator built on the Relative Strength Index. It applies dynamic standard deviation bands directly to the RSI to detect meaningful breakout conditions, then uses the RSI midline as a trend filter to confirm bullish or bearish bias.
How It Works
The indicator calculates upper and lower standard deviation bands around the RSI. A bullish signal is triggered when the RSI breaks above the prior upper band while remaining above the midline, indicating upside momentum with trend confirmation. A bearish signal is triggered when the RSI breaks below the prior lower band while remaining below the midline, indicating downside momentum with trend confirmation. Once a bias is established, it persists until the opposing condition is met.
Visual Features
RSI line and candle colors update dynamically based on the current bullish or bearish state
Upper and lower standard deviation bands plotted with a filled channel for quick visual reference
Midline reference at 50 for trend context
Inputs
RSI Length - controls the RSI calculation period
StdDev Period - controls the lookback for standard deviation band calculation
StdDev Multiplier - adjusts the width of the bands
Alerts
Bullish: RSI > 50 and breaks above the upper standard deviation band
Bearish: RSI < 50 and breaks below the lower standard deviation band
RSI StdDev Trend Breakout is a hybrid momentum and trend indicator built on the Relative Strength Index. It applies dynamic standard deviation bands directly to the RSI to detect meaningful breakout conditions, then uses the RSI midline as a trend filter to confirm bullish or bearish bias.
How It Works
The indicator calculates upper and lower standard deviation bands around the RSI. A bullish signal is triggered when the RSI breaks above the prior upper band while remaining above the midline, indicating upside momentum with trend confirmation. A bearish signal is triggered when the RSI breaks below the prior lower band while remaining below the midline, indicating downside momentum with trend confirmation. Once a bias is established, it persists until the opposing condition is met.
Visual Features
RSI line and candle colors update dynamically based on the current bullish or bearish state
Upper and lower standard deviation bands plotted with a filled channel for quick visual reference
Midline reference at 50 for trend context
Inputs
RSI Length - controls the RSI calculation period
StdDev Period - controls the lookback for standard deviation band calculation
StdDev Multiplier - adjusts the width of the bands
Alerts
Bullish: RSI > 50 and breaks above the upper standard deviation band
Bearish: RSI < 50 and breaks below the lower standard deviation band
Информация о релизе
.Скрипт с открытым кодом
В истинном духе TradingView, создатель этого скрипта сделал его открытым исходным кодом, чтобы трейдеры могли проверить и убедиться в его функциональности. Браво автору! Вы можете использовать его бесплатно, но помните, что перепубликация кода подчиняется нашим Правилам поведения.

Отказ от ответственности
Информация и публикации не предназначены для предоставления и не являются финансовыми, инвестиционными, торговыми или другими видами советов или рекомендаций, предоставленных или одобренных TradingView. Подробнее читайте в Условиях использования.
Скрипт с открытым кодом
В истинном духе TradingView, создатель этого скрипта сделал его открытым исходным кодом, чтобы трейдеры могли проверить и убедиться в его функциональности. Браво автору! Вы можете использовать его бесплатно, но помните, что перепубликация кода подчиняется нашим Правилам поведения.
Отказ от ответственности
Информация и публикации не предназначены для предоставления и не являются финансовыми, инвестиционными, торговыми или другими видами советов или рекомендаций, предоставленных или одобренных TradingView. Подробнее читайте в Условиях использования.