OPEN-SOURCE SCRIPT
Stochastic Resonance Signal [JOAT]
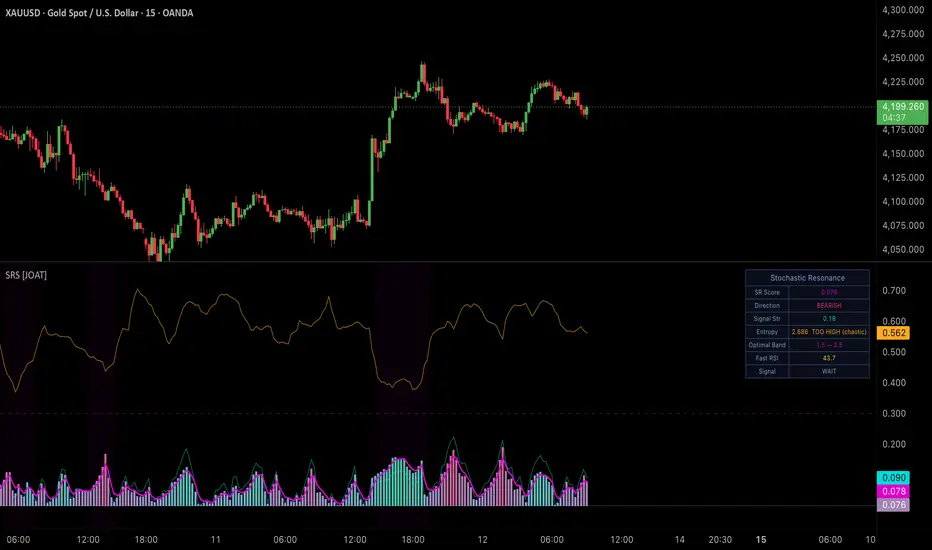
Stochastic Resonance Signal [JOAT]
Introduction
Stochastic Resonance Signal is an open-source indicator built on the physical principle of stochastic resonance — the counterintuitive phenomenon where a moderate level of random noise actually enhances the detection of weak periodic signals rather than degrading it. In trading terms: markets with low volatility noise may suppress trend signals, while a calibrated level of volatility noise can help reveal underlying directional structure.
This indicator computes a signal-to-noise score that normalizes a smoothed price derivative against ATR-based noise. The score peaks when a meaningful directional signal is present within a noise environment that is neither too quiet (which produces false flatness) nor too loud (which obscures the signal entirely).
Core Concepts
1. Signal Component
The raw signal is the smoothed rate of change of price — the first derivative of a filtered price series. An EMA is applied to close to produce a noise-reduced price, then the bar-to-bar difference of that EMA serves as the signal. Positive signal indicates upward momentum; negative indicates downward:
Pine Script®
The signal is normalized by its own rolling standard deviation, making it dimensionless and comparable across instruments.
2. Noise Component
Noise is defined as ATR normalized by its rolling standard deviation. This separates the volatility component from the directional component. When noise is very low, it contributes little penalty. When noise is very high, it heavily discounts the signal. The optimal noise range produces the highest SR score:
Pine Script®

3. SR Score and Threshold
The final SR score combines signal strength divided by noise penalty. The score is plotted as a histogram and compared against a configurable threshold. When the score exceeds the threshold in the positive signal direction, a bullish event fires. When in the negative direction, a bearish event fires. Both require barstate.isconfirmed.
4. Regime Context
The indicator categorizes the current noise state as Low, Optimal, or High. The Optimal zone — where stochastic resonance theory predicts signal enhancement — is highlighted in the background. Signals fired during the Optimal noise zone are the primary intended use case.
Features
Input Parameters
Signal Engine:
Noise Engine:
Signal Gate:
How to Use This Indicator
Step 1: Identify the Noise Regime
Check whether the background shading is active (Optimal zone). Signals fired during optimal noise conditions have the theoretical backing of stochastic resonance theory behind them.
Step 2: Read the SR Score
A rising histogram above the threshold line in positive territory indicates a developing bullish signal. Crossing below the negative threshold indicates a bearish signal.
Step 3: Apply as a Momentum Filter
Use SR score direction to confirm or reject signals from other tools. An SR score rising strongly above its threshold while a support level holds adds conviction to a long setup.
Indicator Limitations
Originality Statement
The application of stochastic resonance theory to price signal detection — computing a signal-to-noise ratio using a normalized price derivative divided by an ATR noise penalty, with an explicit optimal noise zone classification — is an original analytical framing not found in existing published Pine Script indicators. This is not a standard oscillator; it is a physics-inspired signal processing approach adapted to price data.
Disclaimer
This indicator is provided for educational and informational purposes only. It is not financial advice. The stochastic resonance framework is a conceptual model and does not guarantee profitable signals. Trading involves substantial risk of loss.
-Made with passion by jackofalltrades
Introduction
Stochastic Resonance Signal is an open-source indicator built on the physical principle of stochastic resonance — the counterintuitive phenomenon where a moderate level of random noise actually enhances the detection of weak periodic signals rather than degrading it. In trading terms: markets with low volatility noise may suppress trend signals, while a calibrated level of volatility noise can help reveal underlying directional structure.
This indicator computes a signal-to-noise score that normalizes a smoothed price derivative against ATR-based noise. The score peaks when a meaningful directional signal is present within a noise environment that is neither too quiet (which produces false flatness) nor too loud (which obscures the signal entirely).
Core Concepts
1. Signal Component
The raw signal is the smoothed rate of change of price — the first derivative of a filtered price series. An EMA is applied to close to produce a noise-reduced price, then the bar-to-bar difference of that EMA serves as the signal. Positive signal indicates upward momentum; negative indicates downward:
The signal is normalized by its own rolling standard deviation, making it dimensionless and comparable across instruments.
2. Noise Component
Noise is defined as ATR normalized by its rolling standard deviation. This separates the volatility component from the directional component. When noise is very low, it contributes little penalty. When noise is very high, it heavily discounts the signal. The optimal noise range produces the highest SR score:
3. SR Score and Threshold
The final SR score combines signal strength divided by noise penalty. The score is plotted as a histogram and compared against a configurable threshold. When the score exceeds the threshold in the positive signal direction, a bullish event fires. When in the negative direction, a bearish event fires. Both require barstate.isconfirmed.
4. Regime Context
The indicator categorizes the current noise state as Low, Optimal, or High. The Optimal zone — where stochastic resonance theory predicts signal enhancement — is highlighted in the background. Signals fired during the Optimal noise zone are the primary intended use case.
Features
- Normalized signal derivative: EMA-smoothed price rate of change, dimensionless
- ATR noise penalty: Volatility normalized by its own distribution, not a fixed threshold
- SR Score histogram: Visual representation of the signal-to-noise ratio each bar
- Threshold crossover signals: Bull and bear signals when SR score exceeds the gate
- Noise regime classification: Low, Optimal, and High noise zones labeled
- Optimal zone background: Chart shading during the resonance-optimal noise window
- Candle coloring: Candles tinted by current SR score direction and magnitude
- Dashboard: Current SR score, signal value, noise level, and regime state
- Alerts: Configurable bull and bear SR threshold crossing alerts
Input Parameters
Signal Engine:
- Signal EMA Length: Smoothing for price derivative calculation (default: 10)
- Normalization Length: Rolling window for z-score normalization (default: 50)
Noise Engine:
- ATR Period: ATR length for noise estimation (default: 14)
- Optimal Noise Low: Lower bound of optimal noise zone (default: 0.3)
- Optimal Noise High: Upper bound of optimal noise zone (default: 0.8)
Signal Gate:
- SR Score Threshold: Minimum SR score to fire a signal (default: 1.5)
How to Use This Indicator
Step 1: Identify the Noise Regime
Check whether the background shading is active (Optimal zone). Signals fired during optimal noise conditions have the theoretical backing of stochastic resonance theory behind them.
Step 2: Read the SR Score
A rising histogram above the threshold line in positive territory indicates a developing bullish signal. Crossing below the negative threshold indicates a bearish signal.
Step 3: Apply as a Momentum Filter
Use SR score direction to confirm or reject signals from other tools. An SR score rising strongly above its threshold while a support level holds adds conviction to a long setup.
Indicator Limitations
- Stochastic resonance as a trading construct is a theoretical analogy, not a proven quantitative edge on its own
- The optimal noise zone boundaries are heuristic; the true optimal noise level varies by instrument and timeframe
- Normalization requires a minimum lookback before scores stabilize — expect less meaningful output in the first normLen bars
Originality Statement
The application of stochastic resonance theory to price signal detection — computing a signal-to-noise ratio using a normalized price derivative divided by an ATR noise penalty, with an explicit optimal noise zone classification — is an original analytical framing not found in existing published Pine Script indicators. This is not a standard oscillator; it is a physics-inspired signal processing approach adapted to price data.
Disclaimer
This indicator is provided for educational and informational purposes only. It is not financial advice. The stochastic resonance framework is a conceptual model and does not guarantee profitable signals. Trading involves substantial risk of loss.
-Made with passion by jackofalltrades
Скрипт с открытым кодом
В истинном духе TradingView, создатель этого скрипта сделал его открытым исходным кодом, чтобы трейдеры могли проверить и убедиться в его функциональности. Браво автору! Вы можете использовать его бесплатно, но помните, что перепубликация кода подчиняется нашим Правилам поведения.

The Institutional Grade Trading Ecosystem, Built to win trades 📈
Get Access 👇
jackofalltrades.vip 🌐
t.me/jackofalltradesvip 🃏
Get Access 👇
jackofalltrades.vip 🌐
t.me/jackofalltradesvip 🃏
Отказ от ответственности
Информация и публикации не предназначены для предоставления и не являются финансовыми, инвестиционными, торговыми или другими видами советов или рекомендаций, предоставленных или одобренных TradingView. Подробнее читайте в Условиях использования.
Скрипт с открытым кодом
В истинном духе TradingView, создатель этого скрипта сделал его открытым исходным кодом, чтобы трейдеры могли проверить и убедиться в его функциональности. Браво автору! Вы можете использовать его бесплатно, но помните, что перепубликация кода подчиняется нашим Правилам поведения.
The Institutional Grade Trading Ecosystem, Built to win trades 📈
Get Access 👇
jackofalltrades.vip 🌐
t.me/jackofalltradesvip 🃏
Get Access 👇
jackofalltrades.vip 🌐
t.me/jackofalltradesvip 🃏
Отказ от ответственности
Информация и публикации не предназначены для предоставления и не являются финансовыми, инвестиционными, торговыми или другими видами советов или рекомендаций, предоставленных или одобренных TradingView. Подробнее читайте в Условиях использования.