SMC Liquidity PRO | jjart
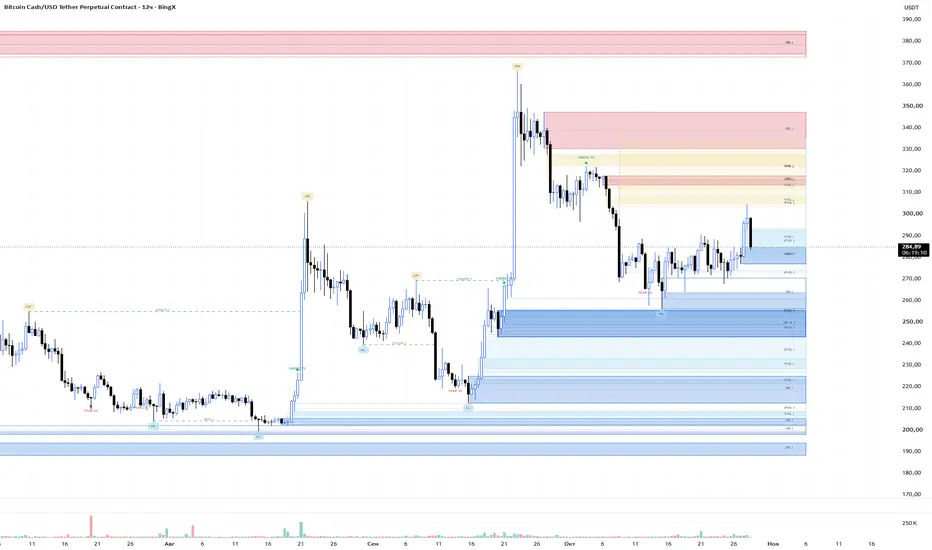
SMC Liquidity PRO — Smart Money Structure & Liquidity Toolkit
Market Structure | BOS / CHoCH | Liquidity Sweeps | Order Blocks | FVG / iFVG / BPR | Fear & Greed
SMC Liquidity PRO is an all-in-one Smart Money Concepts (SMC) indicator designed to transform raw price action into a clean and intuitive trading chart.
Instead of overwhelming traders with outdated signals and overlapping zones, the indicator focuses on market structure, liquidity events, price imbalances, order blocks, and potential reaction areas.
Designed for cryptocurrency, forex, indices, and other liquid markets.
KEY FEATURES
1. SMART MARKET STRUCTURE — HH, HL, LH & LL
Identifies confirmed swing highs and lows:
HH — Higher High
HL — Higher Low
LH — Lower High
LL — Lower Low
BOS — Break of Structure
CHoCH — Change of Character
Structural breaks are displayed using minimalist dashed lines, helping distinguish trend continuation from potential structural reversals. Pivot-based markers are confirmed after the required number of bars and can appear at their historical pivot locations.
2. LIQUIDITY SWEEP DETECTION
Identifies potential buy-side and sell-side liquidity sweeps near structural levels.
Liquidity events are visualized using subtle gray zones and dashed reference lines. Previously retested sweep zones can be removed automatically to reduce chart clutter.
3. DYNAMIC FAIR VALUE GAPS & IMBALANCES
Detects and manages several types of price imbalance:
FVG — Fair Value Gap
GAP — Price Gap
BAP — Custom imbalance classification
iFVG — Inversion Fair Value Gap
BPR — Balanced Price Range
As price partially fills a zone, the highlighted portion is reduced while the original boundaries remain visible. Standard imbalances can be hidden after reaching a configurable mitigation threshold (60% by default).
4. INVERSION FAIR VALUE GAPS (iFVG)
When price closes through a previously detected FVG, the indicator can track its inversion into a zone with the opposite directional role. Traders can monitor former bullish areas as potential resistance and former bearish areas as potential support.
5. BALANCED PRICE RANGES (BPR)
Highlights price ranges created by overlapping bullish and bearish Fair Value Gaps. These zones provide additional context for monitoring price reactions.
6. SMART ORDER BLOCKS
Marks potential bullish and bearish order blocks based on origin candles, price displacement, and structural context.
Blue zones — Bullish order blocks
Red zones — Bearish order blocks
Enhanced highlighting — Blocks associated with structural levels or confirmed breaks
Wick-aware boundaries — Includes relevant candle wick extremes in the zone calculation
Order blocks use a different color system from imbalances, making them easy to distinguish.
7. FEAR & GREED — DIRECTLY ON PRICE CHART
A custom technical sentiment composite combines momentum, trend, and volume conditions.
Green markers — Extreme Greed
Red markers — Extreme Fear
Signals appear directly on price candles. No separate oscillator pane is required.
Important: This is an internally calculated technical indicator, not the external Crypto Fear & Greed Index.
8. MINIMALIST CHART DESIGN
Sky-blue bullish imbalances
Soft-yellow bearish imbalances
Blue bullish order blocks
Red bearish order blocks
Neutral gray liquidity sweep zones
Compact structural labels
Automatic cleanup of outdated zones
Configurable sensitivity and transparency
HOW TO USE
Trend continuation: Identify the prevailing structure, wait for a confirmed BOS, and monitor relevant FVG or order block areas for possible pullbacks.
Potential reversal: Look for a liquidity sweep followed by a structural shift, such as CHoCH. Use nearby imbalances and order blocks for additional context.
Inversion setups: Monitor broken FVG zones that transition into iFVG areas, especially near relevant structure or liquidity levels.
Multi-timeframe analysis: Use higher timeframes to identify broader market context and lower timeframes to refine potential execution areas.
IMPORTANT INFORMATION
SMC Liquidity PRO is a market visualization and technical analysis tool, not an automated trading strategy. Its zones and signals do not guarantee a reversal, trend continuation, or profitable trade. Use appropriate risk management and independently validate any trading approach before live trading.
SMC Liquidity PRO — Less Noise. More Structure. Better Market Context.
TAGS
Market Structure | BOS / CHoCH | Liquidity Sweeps | Order Blocks | FVG / iFVG / BPR | Fear & Greed
SMC Liquidity PRO is an all-in-one Smart Money Concepts (SMC) indicator designed to transform raw price action into a clean and intuitive trading chart.
Instead of overwhelming traders with outdated signals and overlapping zones, the indicator focuses on market structure, liquidity events, price imbalances, order blocks, and potential reaction areas.
Designed for cryptocurrency, forex, indices, and other liquid markets.
KEY FEATURES
1. SMART MARKET STRUCTURE — HH, HL, LH & LL
Identifies confirmed swing highs and lows:
HH — Higher High
HL — Higher Low
LH — Lower High
LL — Lower Low
BOS — Break of Structure
CHoCH — Change of Character
Structural breaks are displayed using minimalist dashed lines, helping distinguish trend continuation from potential structural reversals. Pivot-based markers are confirmed after the required number of bars and can appear at their historical pivot locations.
2. LIQUIDITY SWEEP DETECTION
Identifies potential buy-side and sell-side liquidity sweeps near structural levels.
Liquidity events are visualized using subtle gray zones and dashed reference lines. Previously retested sweep zones can be removed automatically to reduce chart clutter.
3. DYNAMIC FAIR VALUE GAPS & IMBALANCES
Detects and manages several types of price imbalance:
FVG — Fair Value Gap
GAP — Price Gap
BAP — Custom imbalance classification
iFVG — Inversion Fair Value Gap
BPR — Balanced Price Range
As price partially fills a zone, the highlighted portion is reduced while the original boundaries remain visible. Standard imbalances can be hidden after reaching a configurable mitigation threshold (60% by default).
4. INVERSION FAIR VALUE GAPS (iFVG)
When price closes through a previously detected FVG, the indicator can track its inversion into a zone with the opposite directional role. Traders can monitor former bullish areas as potential resistance and former bearish areas as potential support.
5. BALANCED PRICE RANGES (BPR)
Highlights price ranges created by overlapping bullish and bearish Fair Value Gaps. These zones provide additional context for monitoring price reactions.
6. SMART ORDER BLOCKS
Marks potential bullish and bearish order blocks based on origin candles, price displacement, and structural context.
Blue zones — Bullish order blocks
Red zones — Bearish order blocks
Enhanced highlighting — Blocks associated with structural levels or confirmed breaks
Wick-aware boundaries — Includes relevant candle wick extremes in the zone calculation
Order blocks use a different color system from imbalances, making them easy to distinguish.
7. FEAR & GREED — DIRECTLY ON PRICE CHART
A custom technical sentiment composite combines momentum, trend, and volume conditions.
Green markers — Extreme Greed
Red markers — Extreme Fear
Signals appear directly on price candles. No separate oscillator pane is required.
Important: This is an internally calculated technical indicator, not the external Crypto Fear & Greed Index.
8. MINIMALIST CHART DESIGN
Sky-blue bullish imbalances
Soft-yellow bearish imbalances
Blue bullish order blocks
Red bearish order blocks
Neutral gray liquidity sweep zones
Compact structural labels
Automatic cleanup of outdated zones
Configurable sensitivity and transparency
HOW TO USE
Trend continuation: Identify the prevailing structure, wait for a confirmed BOS, and monitor relevant FVG or order block areas for possible pullbacks.
Potential reversal: Look for a liquidity sweep followed by a structural shift, such as CHoCH. Use nearby imbalances and order blocks for additional context.
Inversion setups: Monitor broken FVG zones that transition into iFVG areas, especially near relevant structure or liquidity levels.
Multi-timeframe analysis: Use higher timeframes to identify broader market context and lower timeframes to refine potential execution areas.
IMPORTANT INFORMATION
SMC Liquidity PRO is a market visualization and technical analysis tool, not an automated trading strategy. Its zones and signals do not guarantee a reversal, trend continuation, or profitable trade. Use appropriate risk management and independently validate any trading approach before live trading.
SMC Liquidity PRO — Less Noise. More Structure. Better Market Context.
TAGS

Отказ от ответственности
Информация и публикации не предназначены для предоставления и не являются финансовыми, инвестиционными, торговыми или другими видами советов или рекомендаций, предоставленных или одобренных TradingView. Подробнее читайте в Условиях использования.
Отказ от ответственности
Информация и публикации не предназначены для предоставления и не являются финансовыми, инвестиционными, торговыми или другими видами советов или рекомендаций, предоставленных или одобренных TradingView. Подробнее читайте в Условиях использования.