Обновлено
Volatility Regime and Expansion
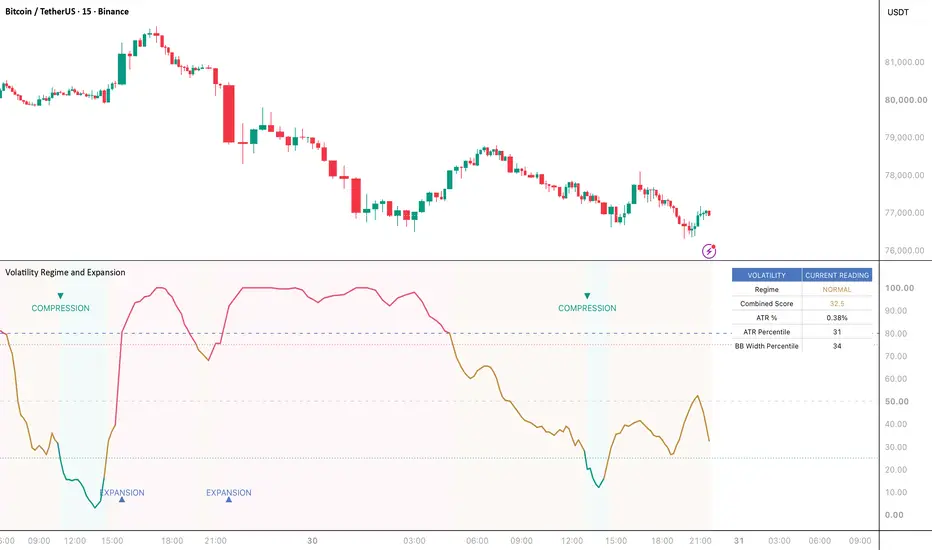
Volatility Regime and Expansion measures current market volatility using two metrics: ATR as a percentage of price and Bollinger Band width. It converts each metric into a percentile based on the selected lookback period, then combines them into a single volatility score.
The score helps classify the current regime as low, normal, or high volatility. Thresholds for each regime are configurable. The indicator marks potential volatility expansion when the score crosses above the expansion threshold, and compression when it crosses into the low-volatility zone. Signals can be set to trigger only after the bar closes.
The statistics table displays the current regime, ATR percentage, ATR percentile, and Bollinger Band width percentile. Background colors reflect the current volatility regime.
Volatility measures the size of price movement, not its direction. Expansion and compression markers are not trade entry or exit signals. The readings depend on the chart timeframe, symbol, and selected settings.
The score helps classify the current regime as low, normal, or high volatility. Thresholds for each regime are configurable. The indicator marks potential volatility expansion when the score crosses above the expansion threshold, and compression when it crosses into the low-volatility zone. Signals can be set to trigger only after the bar closes.
The statistics table displays the current regime, ATR percentage, ATR percentile, and Bollinger Band width percentile. Background colors reflect the current volatility regime.
Volatility measures the size of price movement, not its direction. Expansion and compression markers are not trade entry or exit signals. The readings depend on the chart timeframe, symbol, and selected settings.
Информация о релизе
Visual update — October 30, 2026Added configurable regime and event accents, four-corner table placement, theme-aware contrast and a compact summary with the combined score. Softened regime shading and removed the overlapping score label from the oscillator scale while retaining its Data Window reading. The ATR, Bollinger width, percentile calculations, thresholds, event conditions and alerts are unchanged.
VOLATILITY REGIME AND EXPANSION
A framework for reading activity before choosing a directional setup.
Markets can move from quiet trading to rapidly expanding ranges. This indicator puts two different volatility measurements on a common relative scale, then combines them into a single context reading. It helps answer a specific question: how active is this market compared with its own recent history on this chart?
1. The calculation framework
The first component measures ATR as a percentage of the closing price:
ATR % = ATR / close × 100.
The second measures Bollinger Band width as a percentage of the moving-average basis:
Band width % = (upper band − lower band) / basis × 100.
Each series is converted into a percentile rank over the selected lookback. The combined score is the simple average of those two ranks. Both components have equal weight. A reading of 80 is a combined relative activity score; it is not an 80% chance of a breakout or a directional move.
2. Read the regime
With the default settings:
• LOW: combined score at or below 25.
• NORMAL: score between 25 and 75.
• HIGH: combined score at or above 75.
Teal identifies low activity, amber the normal regime and rose high activity. These colors describe volatility. Rose does not mean bearish, and teal does not mean bullish. The line and optional soft background follow the current regime. A warming-up state appears until both components produce a valid score.
The regime thresholds are editable. Keep the low threshold below the high threshold. If custom thresholds overlap, the high-volatility test has precedence in the displayed regime name; inconsistent settings can make interpretation confusing.
3. Understand the event markers
EXPANSION appears when the combined score crosses above the expansion threshold, which defaults to 80. It marks a transition through a level, rather than printing continuously while the score remains above it.
COMPRESSION appears when the score crosses below the low-volatility threshold, which defaults to 25. Equality with that threshold can already classify the regime as LOW, but the marker requires a cross below it.
The expansion threshold and high-regime threshold are separate inputs. With the defaults, a score can be HIGH without an expansion event on that bar. Expansion and compression markers also occupy different vertical positions for readability; their placement does not encode long or short direction.
4. The statistics panel
The compact panel displays the current regime, combined score, ATR %, ATR percentile and Bollinger width percentile. It exposes the components behind the headline reading so that you can see whether both measures agree or one is driving the average.
Move the panel to any corner of the oscillator pane and adjust the four accents in Display. The panel uses the chart theme for text and background contrast. Regime shading and the panel can be switched off independently. Hiding those visual elements does not disable the alert conditions.
5. A practical reading sequence
First establish the market structure and your relevant price levels. Then inspect whether the volatility context is low, normal or high. Finally, watch for a confirmed threshold crossing and assess the price behavior around those levels using your own setup criteria.
For example, an expansion marker near a range boundary indicates that relative activity has increased. Price may break out, reject the boundary or expand in both directions. The indicator does not decide among those outcomes. Likewise, compression can help identify a quieter environment, but does not predict when that environment will end.
6. Settings and alerts
Defaults are ATR length 14, Bollinger length 20, standard-deviation multiplier 2.0 and percentile lookback 100. The same percentile lookback is applied to both components. Changing a length, the chart timeframe or the symbol changes the comparison set and can change the resulting score.
Signals Only After Bar Closes is enabled by default. With it enabled, expansion and compression conditions qualify on the confirmed bar. Disabling it permits live-bar triggers; the current reading may then move back across the threshold before the bar closes. Create alerts using the named Volatility Expansion or Volatility Compression conditions and choose an alert frequency consistent with your workflow.
7. Scope and limitations
This is a descriptive volatility tool. The combined score is an average of two ranks, rather than the percentile rank of a separately calibrated forecasting model. High readings do not specify the size or direction of the next move, and low readings do not guarantee an imminent breakout. Historical regimes depend on the selected lookback and data available to the chart. Use the readings as context alongside independent price analysis and risk controls.

Отказ от ответственности
Информация и публикации не предназначены для предоставления и не являются финансовыми, инвестиционными, торговыми или другими видами советов или рекомендаций, предоставленных или одобренных TradingView. Подробнее читайте в Условиях использования.
Отказ от ответственности
Информация и публикации не предназначены для предоставления и не являются финансовыми, инвестиционными, торговыми или другими видами советов или рекомендаций, предоставленных или одобренных TradingView. Подробнее читайте в Условиях использования.