OPEN-SOURCE SCRIPT
Обновлено Big Poppa Code Strat & Momentum Strategy Indicator
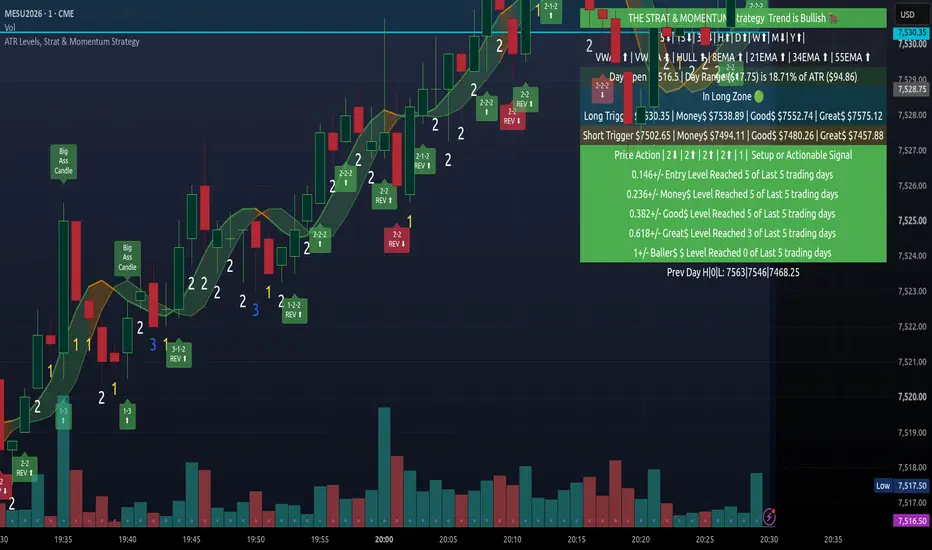
This indicator is a combination of a few things in order to work with a unique trading style gleaned from Callme100k, jrgreatness, TrustMyLevels , FaithInTheStrat, Rob Smith and Saty Mahajan.
This Indicator is created to help you day trade using, ATR Fibonacci Levels, Price Action and Momentum.
It displays Fibonacci Levels Based on ATR to indicate when a security is 0.236, 0.382 +- the Days Open, +- the Days Open, 0.618 +- the Days Open and 1.0 +- Days Open.
To understand this script you need to understand
Average True Range (ATR)
1 Bar Inside Bar
2 Bar Outside Bar (Break either the top or bottom)
3 Bar Engulfing Bar
Strat Setups - 212, 322, 312
Fibonacci - 0.236, 0.382, 0.618, 1.0
Moving Averages
A Trend is considered bullish when (green)
Current Price is greater than the Fast EMA Value (8)
Fast EMA is greater than PIVOT EMA Value (21)
Pivot EMA is greater than SLOW EMA Value (34)
OR Hull is trending up and the Price is above the Volume Weighted Moving Average and price is above VWAP
A trend is considered Bearish when (red)
Current Price is less than the Fast EMA Value (8)
Fast EMA is less than PIVOT EMA Value (21)
Pivot EMA is less than SLOW EMA Value (34)
OR Hull is trending down and the Price is below the Volume Weighted Moving Average and price is below VWAP
If these conditions are not met then the Momentum is in Conflict (orange)
The Momentum band will match the color of the current trend
The table that is present can be turned off at any time lets you see
1) If Moving Averages are showing bullish, bearish or in conflict
2) If There us Time Frame Continuity, (if 5 min up, are all the other timeframes up also)
3) How much of the ATR have we moved on the day
4) Are we in Call or Put range for the day based on ATR Fib Levels
The Ideal situation for entering a call
1) Momentum is Green
2) FTFC on Green
3) A Strat Actionable Signal is present
4) You are in the call range, 0.236 - 0.618 ATR + the Price
5) The ATR still has room, I.e only 50% of the ATR has been run already
Ideal situation from entering a put
1) Momentum is red
2) FTFC on Red
3) A Strat Actionable Signal is present
4) You are in the put range, 0.236 - 0.618 ATR - the Price
5) The ATR still has room, I.e only 50% of the ATR has been run already
Exit the trade for these reasons you entered (for profit or loss)
1) ATR has no more room
2) FTFC is now in conflict
3) Momentum has shifted
Take Profit when
1) You reach a new ATR Level 0.618, 1.0 , -0.618, -1, etc
Passive Stop Loss
1) Open Price if you are aggressive
2) Next ATR Level Down or Up
Feel free to take profit and leave runners
This script does not give signals, you should do your own research, I am not a financial advisors, I am simply applying principles of seasoned veterans to code. You make all decisions about how you buy, sell and trade. The creator of this script makes no promises and takes no responsibility for your personal trading.
To research the methods described above look up
Rob Smith : The Strat
Saty Mahajan : ATR Levels
Fibonacci
Using the HULL Moving Average
Exponential Moving Averages
VWAP
VWMA
This Indicator is created to help you day trade using, ATR Fibonacci Levels, Price Action and Momentum.
It displays Fibonacci Levels Based on ATR to indicate when a security is 0.236, 0.382 +- the Days Open, +- the Days Open, 0.618 +- the Days Open and 1.0 +- Days Open.
To understand this script you need to understand
Average True Range (ATR)
1 Bar Inside Bar
2 Bar Outside Bar (Break either the top or bottom)
3 Bar Engulfing Bar
Strat Setups - 212, 322, 312
Fibonacci - 0.236, 0.382, 0.618, 1.0
Moving Averages
A Trend is considered bullish when (green)
Current Price is greater than the Fast EMA Value (8)
Fast EMA is greater than PIVOT EMA Value (21)
Pivot EMA is greater than SLOW EMA Value (34)
OR Hull is trending up and the Price is above the Volume Weighted Moving Average and price is above VWAP
A trend is considered Bearish when (red)
Current Price is less than the Fast EMA Value (8)
Fast EMA is less than PIVOT EMA Value (21)
Pivot EMA is less than SLOW EMA Value (34)
OR Hull is trending down and the Price is below the Volume Weighted Moving Average and price is below VWAP
If these conditions are not met then the Momentum is in Conflict (orange)
The Momentum band will match the color of the current trend
The table that is present can be turned off at any time lets you see
1) If Moving Averages are showing bullish, bearish or in conflict
2) If There us Time Frame Continuity, (if 5 min up, are all the other timeframes up also)
3) How much of the ATR have we moved on the day
4) Are we in Call or Put range for the day based on ATR Fib Levels
The Ideal situation for entering a call
1) Momentum is Green
2) FTFC on Green
3) A Strat Actionable Signal is present
4) You are in the call range, 0.236 - 0.618 ATR + the Price
5) The ATR still has room, I.e only 50% of the ATR has been run already
Ideal situation from entering a put
1) Momentum is red
2) FTFC on Red
3) A Strat Actionable Signal is present
4) You are in the put range, 0.236 - 0.618 ATR - the Price
5) The ATR still has room, I.e only 50% of the ATR has been run already
Exit the trade for these reasons you entered (for profit or loss)
1) ATR has no more room
2) FTFC is now in conflict
3) Momentum has shifted
Take Profit when
1) You reach a new ATR Level 0.618, 1.0 , -0.618, -1, etc
Passive Stop Loss
1) Open Price if you are aggressive
2) Next ATR Level Down or Up
Feel free to take profit and leave runners
This script does not give signals, you should do your own research, I am not a financial advisors, I am simply applying principles of seasoned veterans to code. You make all decisions about how you buy, sell and trade. The creator of this script makes no promises and takes no responsibility for your personal trading.
To research the methods described above look up
Rob Smith : The Strat
Saty Mahajan : ATR Levels
Fibonacci
Using the HULL Moving Average
Exponential Moving Averages
VWAP
VWMA
Информация о релизе
Minor changeИнформация о релизе
Minor Update on text typoИнформация о релизе
Fixed 3-2 Setup and 3-1 Setup to show up on chartИнформация о релизе
added 5 day back testingИнформация о релизе
Minor ChangeИнформация о релизе
Added Back Testing and 5 days, Adjusted entry levels 0.146Entry Level = 0.146 * ATR plus or minus(+/-) the days open price
Money Level = 0.236 * ATR +/- the days open price
Good Money Level = 0.382 * ATR +/- the days open price
Great Money Level = 0.618 * ATR +/- the days open price
Baller Money Level = ATR +/- the days open price
The entry number is your potential entry, the money number is your Price Target (PT), or potential exit… check FTFC (Full TimeFrame Continuity and Momentum)!!!
You can use indicator either for calls or puts, but, depending on the market direction, play what you see and not what you think!
Keep it simple, control those emotions, wait for your confirmations, buy the options contracts you can afford, and let the charts do the rest…
This also works with advanced strategies like Straddle, Strangle and Iron Condor
Straddle/Strangle Example ( Not financial advice)
1) Buy Call and Put at Open (or atleast at the same time) at the same strike, or using the 0.146 +/- levels as the strike
2) Hold both until 1 reaches 0.236 +/- and cut the loser( or more aggressively by another option on the winning side), if price action starts moving to 0.382 (use strat 1,2,3 and actionable signals)
3) exit winner when the price action goes against you, (if you doubled down you can leave a runner to see if it gets to +/- 0.618)
4) If you kept the loser sell it either when price action retraces to 0.236, or if continue to move against you.
Iron Condor Example (Not financial advice)
1) Buy Put at - 1 ATR
2) Buy A Call at +1 ATR
3) Sell A Put at -.236 ATR
4) Sell A Call at +.236 ATR
5) Open Iron Condor at OPEN and ext IRON Condor at close to Day Close
Информация о релизе
Minor Updates on PlottingИнформация о релизе
You can now toggle between a small chart and a large chartLarge Chart is optimal for desktop and has all data
Small Chart is for mobile trading and gives only the most important Data
Full Time Frame Continuity
ATR Fib Levels
If Momentum is Bullish, Choppy or Bearish
Информация о релизе
Minor Typo Fixed Информация о релизе
Update ChartИнформация о релизе
Big Poppa Codes ATR Levels, Strat Price Action & Momentum Strategy (v2)This indicator is a combination of a few things in order to work with a unique trading style gleaned from CallMe100K, JrGreatness, TrustMyLevels, FaithInTheStrat, Rob Smith and Saty Mahajan. It is created to help you day trade using ATR Fibonacci Levels, Price Action and Momentum. It works on futures, stocks, options underlyings, and crypto because it speaks in Long and Short, not calls and puts.
WHAT IT DISPLAYS
ATR Fibonacci Levels anchored to the day's open:
Long/Short Trigger at 0.146 x ATR (the commitment line), Money$ at 0.236, Good$ at 0.382, Great$ at 0.618, and the full 1.0 ATR level. Above the Long Trigger you are in the Long Zone, below the Short Trigger you are in the Short Zone, and between them the table tells you patience is a virtue.
Momentum Band:
Green when price is stacked above the 8, 21, 34, and 55 EMAs with price above the VWMA, or when the Hull is turning up with price above the VWMA, 8 EMA and VWAP. Red is the mirror image. Orange means momentum is in conflict and the market has not decided.
The Strat, structurally correct:
Every candle is classified as a 1 (inside), 2 (broke one side), or 3 (broke both sides) based on which side of the prior bar broke, never the candle color. Confirmed actionable signals print as labels that name the exact pattern: 2-2 Reversals, 2-1-2 Reversals and Continuations, 3-1-2 Reversals and Continuations, 3-2-2 Reversals, 1-2-2 Reversals, 1-3 Reversals, and 2-2-2 Continuations. Hammer, Star (Shooter), Momo Hammer, Momo Star, and Big Ass Candle print above the bar.
The Info Table:
Full Timeframe Continuity from 5 minutes to yearly (now compared against each timeframe's OPEN per Rob Smith, with the legacy previous close method available in settings), momentum component breakdown, day range as a percent of ATR, your current zone, all level prices, the last 5 candles as Strat scenarios, and how many of the last 5 sessions actually reached each ATR level so you know which targets are realistic this week.
WHAT IS NEW IN V2
1. Scenario 2 detection is now structural. The old version required a green close to count a 2 up, which silently missed valid signals like red 2 ups and equal low breaks. Those print now.
2. The complete actionable signal set is labeled and alertable. Every reversal and continuation combo above has its own alert condition.
3. Hammer and Star geometry is fixed. Shadows are measured from the body edge, the body must sit in the correct third of the range, and body color no longer matters, matching the Strat definitions. Momo variants added for the highest conviction versions.
4. Call and Put language replaced with Long and Short Triggers and Zones.
5. True FTFC by default.
6. Cleaner defaults with individual toggles for scenario numbers, 2-2 reversals, three candle combos, 1-3 reversals, in force setups, Big Ass Candles, and trigger candle close confirmation.
HOW TO USE IT
The ideal long: momentum is green, FTFC is aligned green, price has crossed the Long Trigger into the Long Zone, a bullish Strat actionable signal prints, and less than 50 percent of the day's ATR has been used. Enter on the break of the signal candle's high. Stop below the signal or inside candle, or the day's open if aggressive, or the next ATR level if conservative. Take profit at Money$, Good$, and Great$, and feel free to take profit and leave runners.
The ideal short is the mirror image below the Short Trigger.
Exit for the reasons you entered: the ATR has no more room, FTFC falls into conflict, or momentum shifts to orange.
Signals that print between the triggers are chop until proven otherwise. Let the zone filter and the day range percentage keep you out of the mess in the middle.
This script does not give buy or sell signals. Do your own research. I am not a financial advisor. I am simply applying principles of seasoned veterans to code. You make all decisions about how you buy, sell and trade. The creator of this script makes no promises and takes no responsibility for your personal trading.
To research the methods used here look up Rob Smith (The Strat), Saty Mahajan (ATR Levels), Fibonacci, the Hull Moving Average, Exponential Moving Averages, VWAP and VWMA.
Скрипт с открытым кодом
В истинном духе TradingView, создатель этого скрипта сделал его открытым исходным кодом, чтобы трейдеры могли проверить и убедиться в его функциональности. Браво автору! Вы можете использовать его бесплатно, но помните, что перепубликация кода подчиняется нашим Правилам поведения.

Отказ от ответственности
Информация и публикации не предназначены для предоставления и не являются финансовыми, инвестиционными, торговыми или другими видами советов или рекомендаций, предоставленных или одобренных TradingView. Подробнее читайте в Условиях использования.
Скрипт с открытым кодом
В истинном духе TradingView, создатель этого скрипта сделал его открытым исходным кодом, чтобы трейдеры могли проверить и убедиться в его функциональности. Браво автору! Вы можете использовать его бесплатно, но помните, что перепубликация кода подчиняется нашим Правилам поведения.
Отказ от ответственности
Информация и публикации не предназначены для предоставления и не являются финансовыми, инвестиционными, торговыми или другими видами советов или рекомендаций, предоставленных или одобренных TradingView. Подробнее читайте в Условиях использования.