Crypto ETF Flow Tracker [QuantAlgo]
More exclusive indicators from QuantAlgo
Subscribe to QuantAlgo Essential for $49.99/month to get exclusive indicators by this author. You pay right on TradingView and can use them on your charts straight away.
Explore QuantAlgo Essential🟢 Overview
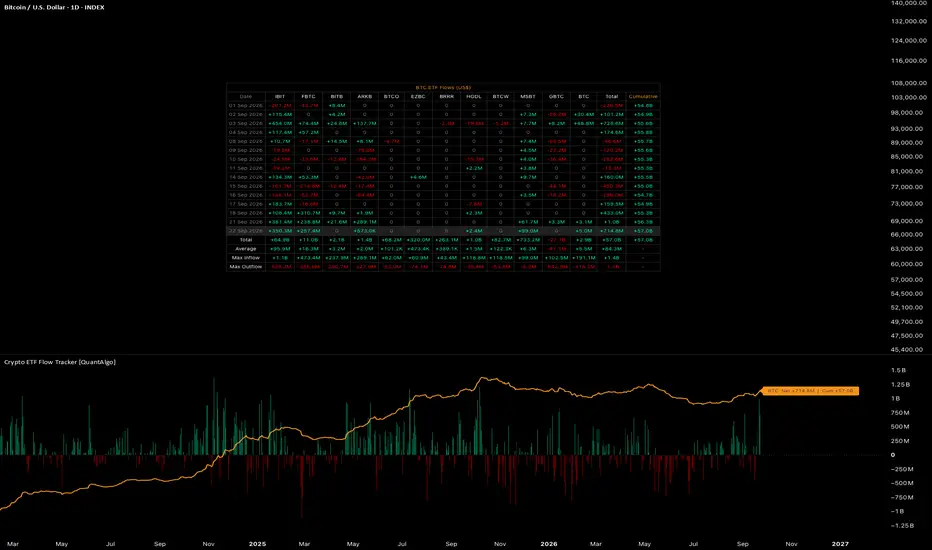
The Crypto ETF Flow Tracker is a data tool for traders who watch where institutional money is moving in crypto. It reads the daily fund flow reported for the US spot crypto ETFs across five assets, gathers the funds of each asset into one table, and draws the same figures below as a histogram with a cumulative line. Bitcoin, Ethereum, Solana, XRP, and Hyperliquid funds are covered, with up to five assets on screen at once and every fund individually includable, so a view can run from the full asset group down to a single issuer's product. Whether you follow the daily print, the trend of cumulative flow, or how one fund is faring against its peers, the indicator turns a scattered set of issuer reports into one dated view on any chart.

🟢 How It Works
Each trading day, every included fund reports its net creation and redemption value through TradingView's ETF fund flow data, and the indicator builds that day's row from those reports: the funds of the asset across the columns, a Total column with the group's net flow for the day, and a Cumulative column with the net flow of every day up to and including it. Below the daily rows, summary rows give the total on record, the average per reporting day, the largest single-day net inflow, and the largest single-day net outflow, for each fund and for the group as a whole.
Flow figures are published by TradingView's data provider during the US session that follows the one they cover, one fund at a time, and the indicator picks each one up as it lands. The newest row fills in through the day, a fund still to report shows a dash, the date wears an asterisk until the row is complete, and hovering the date shows how many funds are in. The chart draws from the same rows, placing each day's total on its own date as a bar, a line, or an area, with the cumulative line running across the loaded history, so the pane and the table tell the same story.

🟢 Key Features
▶ BTC ETFs
The indicator tracks the US spot Bitcoin funds, including IBIT,
 FBTC,
 BITB,
 ARKB,
 BTCO,
 EZBC,
 BRRR,
 HODL,
 BTCW,
 MSBT,
 GBTC, BTC . Every fund is included by default, and new listings will be added in future updates when they are available. This is the deepest group, with the Grayscale trust's outflows and the newer issuers' inflows visible side by side, and the group's cumulative figure reads as the net dollar demand the spot ETF market has brought to Bitcoin since launch.

▶ ETH ETFs
Coverage extends to the US spot Ethereum funds, includingETHA, ETHB, FETH, ETHW, TETH, ETHV, QETH, EZET, MSSE, ETHE, ETH . All of them are switched on from the start, and future launches join the list as they arrive. The columns keep the converted trusts and the funds launched since visible next to each other, while the Total column gives the net Ethereum ETF flow for each session.

▶ SOL ETFs
The tracker follows the US spot Solana funds, includingBSOL, VSOL, FSOL, TSOL, SOEZ, MSOL, GSOL . Each is enabled out of the box, and any new Solana fund will be added in a later update once it is listed. Because these funds are recent, the feed records the launch seed of some of them as a flow on the day before trading began; a Seed Capital setting keeps the feed exactly as published or removes those opening records so the history reflects investor demand alone.

▶ XRP ETFs
On the XRP side the indicator covers XRPC, XRPZ, XRP, GXRP, TOXR . The full set is active by default, with future listings added when they become available. The group is small enough that one fund's day can move the total, which the per-fund columns make easy to spot.

▶ HYPE ETFs
The Hyperliquid group coversBHYP, THYP, HYPG . All three are included from the outset, and newcomers will be added in a future update once they trade. As the youngest group, its table begins on the first session with a reported flow, and its cumulative line starts from that day.

▶ Flow Tables
Five slots decide which assets are on screen and where their tables sit, drawn over the price chart or inside the indicator pane. Each table lists the most recent sessions, up to thirty, oldest at the top and latest at the bottom, with the latest row highlighted. Figures are abbreviated with K, M, and B, signed, and shown to a chosen number of decimal places, in the inflow color for positive values and the outflow color for negative ones, with zero and missing values in neutral. The title and the Cumulative header carry the asset's color, tying a table to its line on the chart at a glance. Average divides each fund's total by the days it has reported since its first non-zero flow, so a fund launched last month is not diluted by the days before it existed.

▶ Flow Chart
Every active slot draws its daily net flow in the pane: as a histogram nested by width so several assets share the space, as a thin line in the asset's color, or as an area filled with the inflow color above zero and the outflow color below. The cumulative line runs in the same asset color and ends in a label that pairs the latest net flow with the cumulative figure, for example "BTC Net +456.8M | Cum +56.8B", with an asterisk (*) on the net figure while funds are still reporting. Because cumulative flow runs into the tens of billions while daily flows sit in the hundreds of millions, the line is fitted into the histogram's range by default with its true value in the label, and can be drawn at its actual value instead. Chart Mode selects the histogram with the cumulative line, either on its own, or Fund Comparison.

▶ Fund Comparison
Fund Comparison replaces the asset view with one line per included fund, each tracing that fund's cumulative flow at its actual value and ending in a label with the fund's name and figure, so the issuers of an asset can be measured against each other over time. The asset's own cumulative line can be added or left off, keeping the scale on the funds themselves.

▶ Built-in Alerts
Ready-made alert conditions fire when the feed delivers a net inflow day or a net outflow day for a tracked asset, when a day clears the large flow threshold in either direction, when an asset flips between net inflow and net outflow versus the prior session, and whenever new flow data is published. The Any alert() function call option carries the asset name, the session date, the figure, and how many funds had reported in its message.

▶ Color Presets
Six presets (Classic, Aqua, Cosmic, Cyber, Neon, Custom) drive the inflow, outflow, and neutral colors used by every table cell and histogram bar, with one palette applied across all assets at once. The assets themselves keep their own colors, BTC orange, ETH blue, SOL purple, XRP gray, and HYPE mint, carried by each table title, cumulative line, and label, so an asset stays recognizable in whichever slot it is placed.

The Crypto ETF Flow Tracker is a data tool for traders who watch where institutional money is moving in crypto. It reads the daily fund flow reported for the US spot crypto ETFs across five assets, gathers the funds of each asset into one table, and draws the same figures below as a histogram with a cumulative line. Bitcoin, Ethereum, Solana, XRP, and Hyperliquid funds are covered, with up to five assets on screen at once and every fund individually includable, so a view can run from the full asset group down to a single issuer's product. Whether you follow the daily print, the trend of cumulative flow, or how one fund is faring against its peers, the indicator turns a scattered set of issuer reports into one dated view on any chart.
🟢 How It Works
Each trading day, every included fund reports its net creation and redemption value through TradingView's ETF fund flow data, and the indicator builds that day's row from those reports: the funds of the asset across the columns, a Total column with the group's net flow for the day, and a Cumulative column with the net flow of every day up to and including it. Below the daily rows, summary rows give the total on record, the average per reporting day, the largest single-day net inflow, and the largest single-day net outflow, for each fund and for the group as a whole.
Flow figures are published by TradingView's data provider during the US session that follows the one they cover, one fund at a time, and the indicator picks each one up as it lands. The newest row fills in through the day, a fund still to report shows a dash, the date wears an asterisk until the row is complete, and hovering the date shows how many funds are in. The chart draws from the same rows, placing each day's total on its own date as a bar, a line, or an area, with the cumulative line running across the loaded history, so the pane and the table tell the same story.
🟢 Key Features
▶ BTC ETFs
The indicator tracks the US spot Bitcoin funds, including
IBIT, FBTC, BITB, ARKB, BTCO, EZBC, BRRR, HODL, BTCW, MSBT, GBTC, BTC . Every fund is included by default, and new listings will be added in future updates when they are available. This is the deepest group, with the Grayscale trust's outflows and the newer issuers' inflows visible side by side, and the group's cumulative figure reads as the net dollar demand the spot ETF market has brought to Bitcoin since launch.▶ ETH ETFs
Coverage extends to the US spot Ethereum funds, including
ETHA, ETHB, FETH, ETHW, TETH, ETHV, QETH, EZET, MSSE, ETHE, ETH . All of them are switched on from the start, and future launches join the list as they arrive. The columns keep the converted trusts and the funds launched since visible next to each other, while the Total column gives the net Ethereum ETF flow for each session.▶ SOL ETFs
The tracker follows the US spot Solana funds, including
BSOL, VSOL, FSOL, TSOL, SOEZ, MSOL, GSOL . Each is enabled out of the box, and any new Solana fund will be added in a later update once it is listed. Because these funds are recent, the feed records the launch seed of some of them as a flow on the day before trading began; a Seed Capital setting keeps the feed exactly as published or removes those opening records so the history reflects investor demand alone.▶ XRP ETFs
On the XRP side the indicator covers
XRPC, XRPZ, XRP, GXRP, TOXR . The full set is active by default, with future listings added when they become available. The group is small enough that one fund's day can move the total, which the per-fund columns make easy to spot.▶ HYPE ETFs
The Hyperliquid group covers
BHYP, THYP, HYPG . All three are included from the outset, and newcomers will be added in a future update once they trade. As the youngest group, its table begins on the first session with a reported flow, and its cumulative line starts from that day.▶ Flow Tables
Five slots decide which assets are on screen and where their tables sit, drawn over the price chart or inside the indicator pane. Each table lists the most recent sessions, up to thirty, oldest at the top and latest at the bottom, with the latest row highlighted. Figures are abbreviated with K, M, and B, signed, and shown to a chosen number of decimal places, in the inflow color for positive values and the outflow color for negative ones, with zero and missing values in neutral. The title and the Cumulative header carry the asset's color, tying a table to its line on the chart at a glance. Average divides each fund's total by the days it has reported since its first non-zero flow, so a fund launched last month is not diluted by the days before it existed.
▶ Flow Chart
Every active slot draws its daily net flow in the pane: as a histogram nested by width so several assets share the space, as a thin line in the asset's color, or as an area filled with the inflow color above zero and the outflow color below. The cumulative line runs in the same asset color and ends in a label that pairs the latest net flow with the cumulative figure, for example "BTC Net +456.8M | Cum +56.8B", with an asterisk (*) on the net figure while funds are still reporting. Because cumulative flow runs into the tens of billions while daily flows sit in the hundreds of millions, the line is fitted into the histogram's range by default with its true value in the label, and can be drawn at its actual value instead. Chart Mode selects the histogram with the cumulative line, either on its own, or Fund Comparison.
▶ Fund Comparison
Fund Comparison replaces the asset view with one line per included fund, each tracing that fund's cumulative flow at its actual value and ending in a label with the fund's name and figure, so the issuers of an asset can be measured against each other over time. The asset's own cumulative line can be added or left off, keeping the scale on the funds themselves.
▶ Built-in Alerts
Ready-made alert conditions fire when the feed delivers a net inflow day or a net outflow day for a tracked asset, when a day clears the large flow threshold in either direction, when an asset flips between net inflow and net outflow versus the prior session, and whenever new flow data is published. The Any alert() function call option carries the asset name, the session date, the figure, and how many funds had reported in its message.
▶ Color Presets
Six presets (Classic, Aqua, Cosmic, Cyber, Neon, Custom) drive the inflow, outflow, and neutral colors used by every table cell and histogram bar, with one palette applied across all assets at once. The assets themselves keep their own colors, BTC orange, ETH blue, SOL purple, XRP gray, and HYPE mint, carried by each table title, cumulative line, and label, so an asset stays recognizable in whichever slot it is placed.

🟢 Access our best trading & investing tools: joinquantalgo.com/plans
🟢 Free Special Edition indicators: joinquantalgo.com/special-editions
🟢 Discord: discord.gg/hJaFyGEAyX
🟢 Free Special Edition indicators: joinquantalgo.com/special-editions
🟢 Discord: discord.gg/hJaFyGEAyX
Отказ от ответственности
Информация и публикации не предназначены для предоставления и не являются финансовыми, инвестиционными, торговыми или другими видами советов или рекомендаций, предоставленных или одобренных TradingView. Подробнее читайте в Условиях использования.
🟢 Access our best trading & investing tools: joinquantalgo.com/plans
🟢 Free Special Edition indicators: joinquantalgo.com/special-editions
🟢 Discord: discord.gg/hJaFyGEAyX
🟢 Free Special Edition indicators: joinquantalgo.com/special-editions
🟢 Discord: discord.gg/hJaFyGEAyX
Отказ от ответственности
Информация и публикации не предназначены для предоставления и не являются финансовыми, инвестиционными, торговыми или другими видами советов или рекомендаций, предоставленных или одобренных TradingView. Подробнее читайте в Условиях использования.