Обновлено
Nasdaq Up Volume vs Down Volume
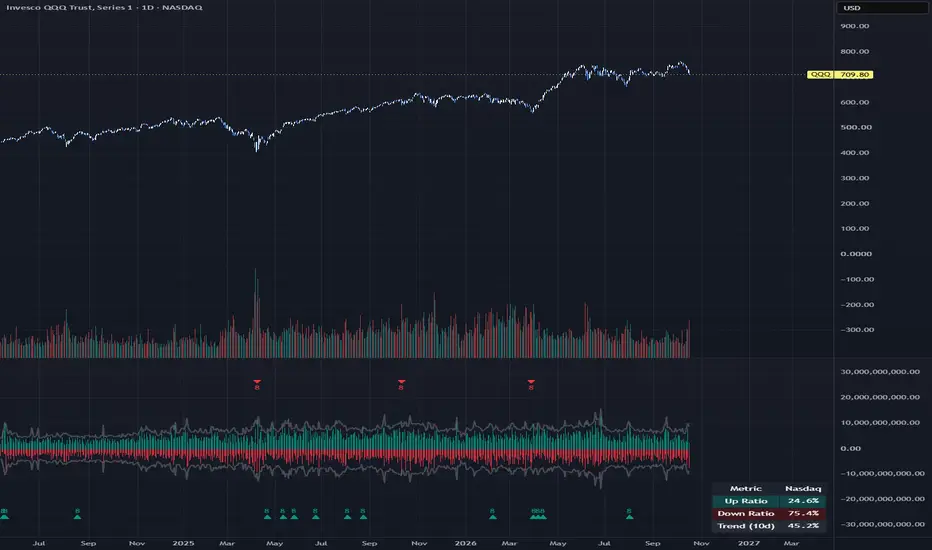
Nasdaq Up Volume vs Down Volume
A market breadth indicator that measures buying and selling pressure across the Nasdaq using advancing volume (UPVOL.NQ) and declining volume (DNVOL.NQ).
It calculates the percentage of total Nasdaq volume occurring in advancing versus declining stocks, making it useful for identifying strong participation, heavy selling, and potential capitulation or breadth-thrust conditions.
Key Features
Up Volume % and Down Volume % calculated in real time
Cumulative or Relative display modes
Split or Stacked layout options
80% and 90% markers for extreme volume days
Optional 90% threshold guide lines
KPI table showing current Up Ratio, Down Ratio, and a short-term trend reading
Built-in alerts for 80% and 90% up-volume and down-volume days
Works on any timeframe; optional extended-hours data
How to Interpret
Down Volume ≥ 80% — Broad selling pressure
Down Volume ≥ 90% — Extreme selling / potential capitulation conditions
Up Volume ≥ 80% — Strong buying participation
Up Volume ≥ 90% — Broad-based buying / potential breadth thrust
Readings near 50% indicate balanced volume participation
Inputs
Include Pre/Post Market Data
Breadth Trend Length
Mode (Cumulative / Relative)
Layout (Split / Stacked)
Color Style (Static / Gradient)
Show 90% Threshold
KPI table options (visibility, compact mode, text size, position)
The indicator is designed for traders who want a clear view of Nasdaq volume breadth alongside price action on QQQ, NQ, or individual Nasdaq stocks.
A market breadth indicator that measures buying and selling pressure across the Nasdaq using advancing volume (UPVOL.NQ) and declining volume (DNVOL.NQ).
It calculates the percentage of total Nasdaq volume occurring in advancing versus declining stocks, making it useful for identifying strong participation, heavy selling, and potential capitulation or breadth-thrust conditions.
Key Features
Up Volume % and Down Volume % calculated in real time
Cumulative or Relative display modes
Split or Stacked layout options
80% and 90% markers for extreme volume days
Optional 90% threshold guide lines
KPI table showing current Up Ratio, Down Ratio, and a short-term trend reading
Built-in alerts for 80% and 90% up-volume and down-volume days
Works on any timeframe; optional extended-hours data
How to Interpret
Down Volume ≥ 80% — Broad selling pressure
Down Volume ≥ 90% — Extreme selling / potential capitulation conditions
Up Volume ≥ 80% — Strong buying participation
Up Volume ≥ 90% — Broad-based buying / potential breadth thrust
Readings near 50% indicate balanced volume participation
Inputs
Include Pre/Post Market Data
Breadth Trend Length
Mode (Cumulative / Relative)
Layout (Split / Stacked)
Color Style (Static / Gradient)
Show 90% Threshold
KPI table options (visibility, compact mode, text size, position)
The indicator is designed for traders who want a clear view of Nasdaq volume breadth alongside price action on QQQ, NQ, or individual Nasdaq stocks.
Информация о релизе
Update
Отказ от ответственности
Информация и публикации не предназначены для предоставления и не являются финансовыми, инвестиционными, торговыми или другими видами советов или рекомендаций, предоставленных или одобренных TradingView. Подробнее читайте в Условиях использования.
Отказ от ответственности
Информация и публикации не предназначены для предоставления и не являются финансовыми, инвестиционными, торговыми или другими видами советов или рекомендаций, предоставленных или одобренных TradingView. Подробнее читайте в Условиях использования.