OPEN-SOURCE SCRIPT
Обновлено QuantFlow: Precision Fibonacci VWAP

QuantFlow: Precision Fibonacci VWAP is a professional-grade institutional trading suite designed for traders who demand quantitative precision. By merging MIDAS (Multidaily Institutional Digital Analysis Support) volume-weighting with Gaussian statistical probability and Fibonacci expansion theory, this indicator provides a comprehensive map of market structure, volatility, and high-probability reversal zones.
█ The Quantitative Core
At the heart of QuantFlow Precison is a sophisticated calculation engine that goes beyond standard moving averages.
MIDAS Engine: Instead of a simple VWAP, QuantFlow Precision utilizes the MIDAS approach, calculating cumulative volume-weighted price from a specific "Anchor Point." This reveals the true average price where institutional orders are concentrated.
Adaptive Anchoring: The "Auto" mode intelligently detects your chart's timeframe to provide the most relevant anchor:
Scalping (1m–15m): Resets Daily to capture intraday liquidity flows.
Intraday (15m–1h): Resets Weekly to identify the current week's "Fair Value."
Swing (Daily+): Resets Monthly or Yearly for long-term trend benchmarks.
█ Strategic Volatility Bands
QuantFlow Precision generates 6 levels of Fibonacci-weighted bands based on volume-weighted standard deviation. These bands act as dynamic support and resistance that expand and contract with market volatility.
Inner Bands (Levels 1-2): Define the "Equilibrium Zone." Price remaining here indicates a ranging market or consolidation.
Expansion Bands (Levels 3-4): Represent confirmed trend momentum.
Extreme Bands (Levels 5-6): These are the 1.0 and 1.618 Fibonacci extensions. When price reaches these levels, it is entering a "statistical extreme," often preceding a sharp mean-reversion.
█ Gaussian Probability Dashboard
The real-time information table provides a professional "heads-up display" (HUD) of current market statistics:
Z-Score Analysis: Measures how many standard deviations the price has moved away from the mean. A Z-Score > 2.0 indicates a move that occurs less than 5% of the time, signaling a potential reversal.
Reversion Probability: Uses the 68-95-99.7 rule to estimate the statistical likelihood of price returning to the VWAP. When the probability hits 99%, the market is at a historical breaking point.
Distance %: Displays the exact percentage gap between current price and "Fair Value."
█ Visual Intelligence System
QuantFlow Precision is designed for high-speed decision-making with a high-contrast UI:
Fluor Green Candles: Confirmed bullish momentum (Price > Upper Fib 1).
Fluor Red Candles: Confirmed bearish momentum (Price < Lower Fib 1).
Grey Candles: Market is in "No-Man's Land" (Ranging within Fib 1/2).
Crossover Stars (★): Tiny star markers appear the moment price reclaims or loses the VWAP line, signaling an immediate shift in institutional control.
Extreme Sparkle Markers (✦): These high-contrast markers trigger when the price pierces the Level 6 (1.618) Fibonacci band. They represent statistical "exhaustion" points where the market has moved into the most extreme 1% of volatility, signaling a high-probability reversal zone.
Target Labels: Every Fibonacci level is labeled on the right side of the chart with its specific level and current price.
█ Trading Applications
The Scalper: Uses the Daily Auto Anchor to trade mean-reversions at the Level 6 sparkle (✦) markers during high-volatility sessions.
The Trend Trader: Enters on a Fluor Green/Red candle change and uses the MIDAS VWAP as a dynamic trailing stop.
The Swing Trader: Sets a Manual Anchor Date on a major news event (e.g., FOMC or Earnings) to track the long-term institutional volume profile.
This indicator is intended for educational and informational purposes only and should not be considered financial advice. Trading involves significant risk, and you should consult with a financial advisor before making any trading decisions. The performance of this indicator is not guaranteed, and past results do not predict future performance. Use at your own risk.
█ The Quantitative Core
At the heart of QuantFlow Precison is a sophisticated calculation engine that goes beyond standard moving averages.
MIDAS Engine: Instead of a simple VWAP, QuantFlow Precision utilizes the MIDAS approach, calculating cumulative volume-weighted price from a specific "Anchor Point." This reveals the true average price where institutional orders are concentrated.
Adaptive Anchoring: The "Auto" mode intelligently detects your chart's timeframe to provide the most relevant anchor:
Scalping (1m–15m): Resets Daily to capture intraday liquidity flows.
Intraday (15m–1h): Resets Weekly to identify the current week's "Fair Value."
Swing (Daily+): Resets Monthly or Yearly for long-term trend benchmarks.
█ Strategic Volatility Bands
QuantFlow Precision generates 6 levels of Fibonacci-weighted bands based on volume-weighted standard deviation. These bands act as dynamic support and resistance that expand and contract with market volatility.
Inner Bands (Levels 1-2): Define the "Equilibrium Zone." Price remaining here indicates a ranging market or consolidation.
Expansion Bands (Levels 3-4): Represent confirmed trend momentum.
Extreme Bands (Levels 5-6): These are the 1.0 and 1.618 Fibonacci extensions. When price reaches these levels, it is entering a "statistical extreme," often preceding a sharp mean-reversion.
█ Gaussian Probability Dashboard
The real-time information table provides a professional "heads-up display" (HUD) of current market statistics:
Z-Score Analysis: Measures how many standard deviations the price has moved away from the mean. A Z-Score > 2.0 indicates a move that occurs less than 5% of the time, signaling a potential reversal.
Reversion Probability: Uses the 68-95-99.7 rule to estimate the statistical likelihood of price returning to the VWAP. When the probability hits 99%, the market is at a historical breaking point.
Distance %: Displays the exact percentage gap between current price and "Fair Value."
█ Visual Intelligence System
QuantFlow Precision is designed for high-speed decision-making with a high-contrast UI:
Fluor Green Candles: Confirmed bullish momentum (Price > Upper Fib 1).
Fluor Red Candles: Confirmed bearish momentum (Price < Lower Fib 1).
Grey Candles: Market is in "No-Man's Land" (Ranging within Fib 1/2).
Crossover Stars (★): Tiny star markers appear the moment price reclaims or loses the VWAP line, signaling an immediate shift in institutional control.
Extreme Sparkle Markers (✦): These high-contrast markers trigger when the price pierces the Level 6 (1.618) Fibonacci band. They represent statistical "exhaustion" points where the market has moved into the most extreme 1% of volatility, signaling a high-probability reversal zone.
Target Labels: Every Fibonacci level is labeled on the right side of the chart with its specific level and current price.
█ Trading Applications
The Scalper: Uses the Daily Auto Anchor to trade mean-reversions at the Level 6 sparkle (✦) markers during high-volatility sessions.
The Trend Trader: Enters on a Fluor Green/Red candle change and uses the MIDAS VWAP as a dynamic trailing stop.
The Swing Trader: Sets a Manual Anchor Date on a major news event (e.g., FOMC or Earnings) to track the long-term institutional volume profile.
This indicator is intended for educational and informational purposes only and should not be considered financial advice. Trading involves significant risk, and you should consult with a financial advisor before making any trading decisions. The performance of this indicator is not guaranteed, and past results do not predict future performance. Use at your own risk.
Информация о релизе
Chart update!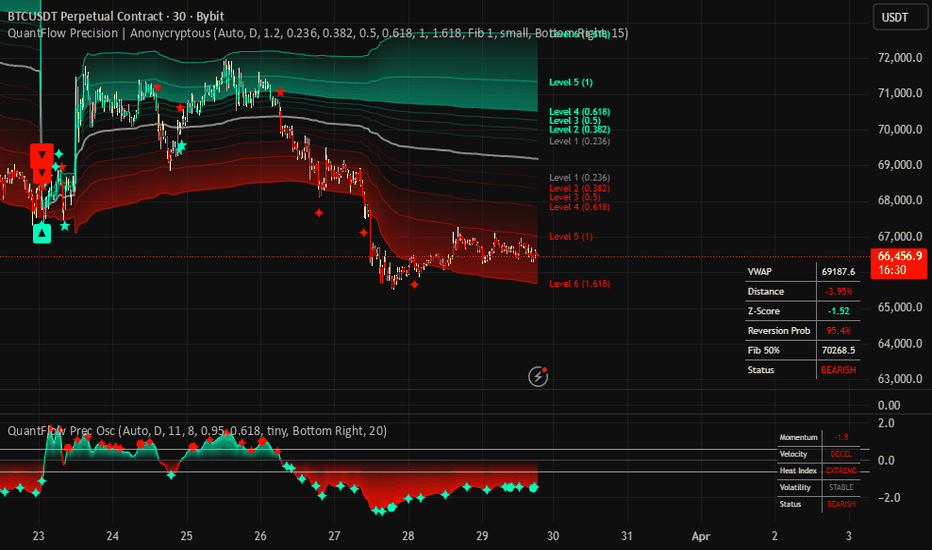
Usefull Oscillator as standalone confluence or combined with the Quantflow: Precision Fibonacci VWAP
Информация о релизе
Chart update!!Информация о релизе
How to use: █ Institutional Fair Value & Velocity Analysis
The QuantFlow VWAP is a dual-purpose engine. On Lower Timeframes (LTF), it acts as a high-speed mean-reversion tool. On Higher Timeframes (HTF), it serves as the ultimate institutional trend benchmark.
█ Lower Timeframe Strategy (1m – 15m)
Scalping and Intraday Momentum
The Entry Confirmation (★): On the 1m–5m charts, look for the Bullish/Bearish Star (★). This signals that price has reclaimed the "Institutional Fair Value" (VWAP) with volume. Confirm the candle has flipped to Fluor Green/Red.
The Reversion Play (✦): If price hits the Level 6 (1.618) Fibonacci Band and a Sparkle (✦) appears, check the Dashboard. If Reversion Prob is >99%, expect a snap-back move to the VWAP line.
Avoiding the Chop: If the candles are Grey, the market is in equilibrium. Do not enter new trades; wait for a breakout star (★) to confirm a direction.
█ Higher Timeframe Strategy (1H – Daily)
Swing Trading and Macro Trend Identification
Determining the Bias: If candles are Fluor Green and staying above the VWAP, the macro bias is bullish. Institutional players are "buying the dip" at the VWAP line.
The Institutional Anchor: For long-term moves, set your Anchor Method to "Auto" or a specific Manual Date (like the start of the Month or Year). This shows you the true volume-weighted cost basis for the entire period.
Risk Management: Use the MIDAS VWAP line as your definitive stop-loss or "Trend Invalidation" level. As long as price remains above/below the line, the trend is technically intact.
Macro Targets: Use the Level 5 (1.0) and Level 6 (1.618) bands as your ultimate Take-Profit zones for swing positions.
█ Dashboard HUD: Professional Decision Making
Z-Score: If Z-Score is >2.0 or <-2.0, the move is statistically rare. Prepare for a trend pause.
Reversion Prob: Use this to filter out bad entries. Never go long if the prob is >95% (Fluor Red) at the top bands; you are buying the statistical peak.
Status: Instantly tells you if the market is BULLISH, BEARISH, or RANGING based on the 0.236 Fibonacci "Filter Zone."
Summary:
LTF: Trade the Sparks and Stars for quick entries/exits.
HTF: Use the Candle Colors and VWAP Line to ride macro institutional flows combinated with the sparks and stars.
Скрипт с открытым кодом
В истинном духе TradingView, создатель этого скрипта сделал его открытым исходным кодом, чтобы трейдеры могли проверить и убедиться в его функциональности. Браво автору! Вы можете использовать его бесплатно, но помните, что перепубликация кода подчиняется нашим Правилам поведения.

Отказ от ответственности
Информация и публикации не предназначены для предоставления и не являются финансовыми, инвестиционными, торговыми или другими видами советов или рекомендаций, предоставленных или одобренных TradingView. Подробнее читайте в Условиях использования.
Скрипт с открытым кодом
В истинном духе TradingView, создатель этого скрипта сделал его открытым исходным кодом, чтобы трейдеры могли проверить и убедиться в его функциональности. Браво автору! Вы можете использовать его бесплатно, но помните, что перепубликация кода подчиняется нашим Правилам поведения.
Отказ от ответственности
Информация и публикации не предназначены для предоставления и не являются финансовыми, инвестиционными, торговыми или другими видами советов или рекомендаций, предоставленных или одобренных TradingView. Подробнее читайте в Условиях использования.