OPEN-SOURCE SCRIPT
EMA 100 / 200 / 300
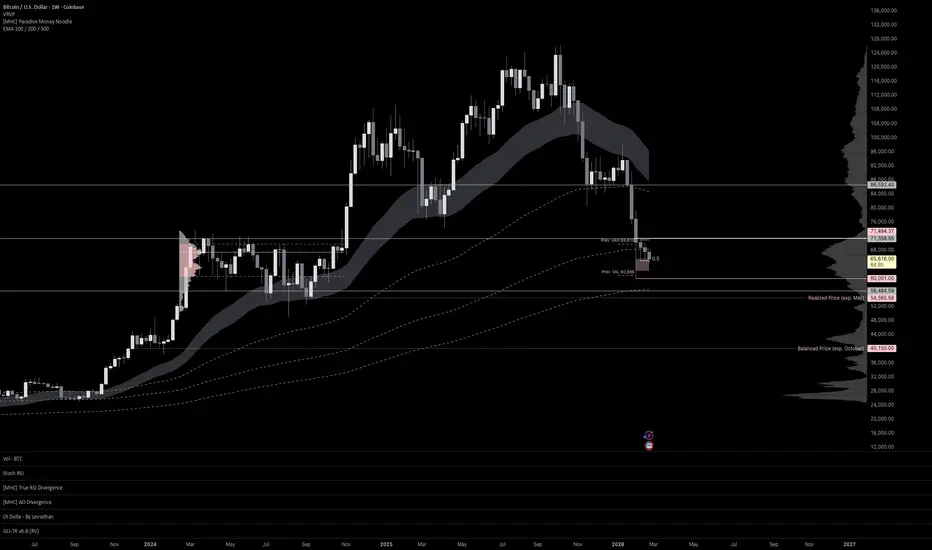
Short Description:
A clean overlay of three key Exponential Moving Averages (100, 200, 300) for trend identification and dynamic support/resistance.
Description:
This indicator plots three widely used Exponential Moving Averages directly on your chart:
🟡 EMA 100 – Medium-term trend filter
🔵 EMA 200 – The institutional benchmark for long-term trend direction
🔴 EMA 300 – Deep trend structure and macro support/resistance
How to use:
Price above all three EMAs → Strong bullish structure
Price below all three EMAs → Strong bearish structure
EMA crossovers and convergence/divergence signal potential trend shifts
Use as dynamic support & resistance zones on higher timeframes (4H, Daily, Weekly)
Features:
Fully customizable lengths via input settings
Clean and lightweight – no chart clutter
Works on all assets and timeframes
Best used in combination with volume, order flow, and key level analysis for high-confluence setups.
Скрипт с открытым кодом
В истинном духе TradingView, создатель этого скрипта сделал его открытым исходным кодом, чтобы трейдеры могли проверить и убедиться в его функциональности. Браво автору! Вы можете использовать его бесплатно, но помните, что перепубликация кода подчиняется нашим Правилам поведения.

Отказ от ответственности
Информация и публикации не предназначены для предоставления и не являются финансовыми, инвестиционными, торговыми или другими видами советов или рекомендаций, предоставленных или одобренных TradingView. Подробнее читайте в Условиях использования.
Скрипт с открытым кодом
В истинном духе TradingView, создатель этого скрипта сделал его открытым исходным кодом, чтобы трейдеры могли проверить и убедиться в его функциональности. Браво автору! Вы можете использовать его бесплатно, но помните, что перепубликация кода подчиняется нашим Правилам поведения.
Отказ от ответственности
Информация и публикации не предназначены для предоставления и не являются финансовыми, инвестиционными, торговыми или другими видами советов или рекомендаций, предоставленных или одобренных TradingView. Подробнее читайте в Условиях использования.