OPEN-SOURCE SCRIPT
Markov Regime 2.0 - Bull / Bear / Sideways
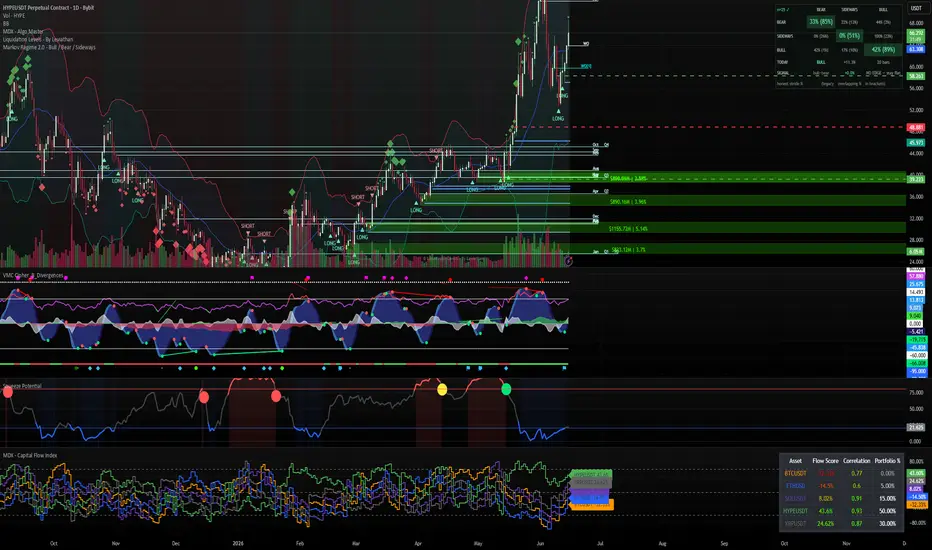
Here's a publish-ready description for the indicator — written to be honest about what it does and doesn't do (in the spirit of the method):
---
**Markov Regime 2.0 — Bull / Bear / Sideways**
A market-regime model that labels price history into Bull / Bear / Sideways states, builds the Markov transition matrix between them, and turns the regime's persistence into a directional signal. This is a corrected rebuild of the classic Markov regime indicator, with three statistical flaws fixed — so the numbers it shows are honest rather than flattering.
**How it works**
- Each bar is labelled by its rolling N-day return: ≥ +5% = Bull, ≤ −5% = Bear, otherwise Sideways (all configurable).
- It counts how often each state transitions to each other state and normalises into a 3×3 probability matrix. The diagonal is the regime "stickiness" — how likely a state is to persist.
- The signal is `P(bull next) − P(bear next)` from today's regime row: sign = direction, magnitude = conviction.
**The three corrections (what makes it 2.0)**
1. **Stride sampling (the autocorrelation fix).** The original counted a transition on *every* bar — but consecutive rolling windows share all but one bar, which manufactures fake persistence on the diagonal. 2.0 also counts transitions between *non-overlapping* windows (stride = lookback). Each matrix cell shows `honest stride % (legacy overlapping % in brackets)` so you can see the inflation directly.
2. **Label self-check.** Before displaying, it verifies that mean return of Bear < Sideways < Bull and flags a `✓`/`✗` next to the sample size — so a mislabelled state can't ship silently.
3. **Explicit signal + modes.** A real signal with a no-edge deadband (Standalone mode sizes a position by conviction; Filter mode just gates longs/shorts), instead of pure visualisation.
**On the chart**
- A compact dashboard: the transition matrix, current regime (TODAY), the live signal with a verdict (`stay flat` / `LONG x%` / `SHORT x%`), sample size and label-check.
- Optional regime ribbon and state-transition labels.
- **Edge markers:** ▲ LONG / ▼ SHORT print on the candle where the *walk-forward* signal first crosses the deadband. The per-bar signal uses only data available up to that bar (no look-ahead), so markers on closed bars don't repaint. Matching alerts are built in.
**How to read it**
Use it on a daily chart — the default is a ~20-*day* regime concept. Treat the honest (stride) column as the real one; if it sits near 33% (a 3-state coin flip) and the signal stays inside the deadband, the model is telling you there's **no edge — stay flat**, and that's a valid answer. The bracketed legacy values are shown only to expose how much the old overlapping method exaggerates persistence. Small-history assets will have a low transition count (`n=`) — the smaller that number, the less you should trust the matrix.
**Disclaimer**
This is a research and visualisation tool, not financial advice and not a strategy with a guaranteed edge. It reads regimes and reports what your own rules imply; it does not place trades. Past regime behaviour does not predict future returns. Always size and manage risk yourself.
Original framework: Roan (@RohOnChain). 2.0 corrections per the Markov 2.0 method.
---
Want a **short version** (2–3 lines for the script's one-liner subtitle), or should I drop this straight into the code as the top comment block / an `//description` line?
---
**Markov Regime 2.0 — Bull / Bear / Sideways**
A market-regime model that labels price history into Bull / Bear / Sideways states, builds the Markov transition matrix between them, and turns the regime's persistence into a directional signal. This is a corrected rebuild of the classic Markov regime indicator, with three statistical flaws fixed — so the numbers it shows are honest rather than flattering.
**How it works**
- Each bar is labelled by its rolling N-day return: ≥ +5% = Bull, ≤ −5% = Bear, otherwise Sideways (all configurable).
- It counts how often each state transitions to each other state and normalises into a 3×3 probability matrix. The diagonal is the regime "stickiness" — how likely a state is to persist.
- The signal is `P(bull next) − P(bear next)` from today's regime row: sign = direction, magnitude = conviction.
**The three corrections (what makes it 2.0)**
1. **Stride sampling (the autocorrelation fix).** The original counted a transition on *every* bar — but consecutive rolling windows share all but one bar, which manufactures fake persistence on the diagonal. 2.0 also counts transitions between *non-overlapping* windows (stride = lookback). Each matrix cell shows `honest stride % (legacy overlapping % in brackets)` so you can see the inflation directly.
2. **Label self-check.** Before displaying, it verifies that mean return of Bear < Sideways < Bull and flags a `✓`/`✗` next to the sample size — so a mislabelled state can't ship silently.
3. **Explicit signal + modes.** A real signal with a no-edge deadband (Standalone mode sizes a position by conviction; Filter mode just gates longs/shorts), instead of pure visualisation.
**On the chart**
- A compact dashboard: the transition matrix, current regime (TODAY), the live signal with a verdict (`stay flat` / `LONG x%` / `SHORT x%`), sample size and label-check.
- Optional regime ribbon and state-transition labels.
- **Edge markers:** ▲ LONG / ▼ SHORT print on the candle where the *walk-forward* signal first crosses the deadband. The per-bar signal uses only data available up to that bar (no look-ahead), so markers on closed bars don't repaint. Matching alerts are built in.
**How to read it**
Use it on a daily chart — the default is a ~20-*day* regime concept. Treat the honest (stride) column as the real one; if it sits near 33% (a 3-state coin flip) and the signal stays inside the deadband, the model is telling you there's **no edge — stay flat**, and that's a valid answer. The bracketed legacy values are shown only to expose how much the old overlapping method exaggerates persistence. Small-history assets will have a low transition count (`n=`) — the smaller that number, the less you should trust the matrix.
**Disclaimer**
This is a research and visualisation tool, not financial advice and not a strategy with a guaranteed edge. It reads regimes and reports what your own rules imply; it does not place trades. Past regime behaviour does not predict future returns. Always size and manage risk yourself.
Original framework: Roan (@RohOnChain). 2.0 corrections per the Markov 2.0 method.
---
Want a **short version** (2–3 lines for the script's one-liner subtitle), or should I drop this straight into the code as the top comment block / an `//description` line?
Скрипт с открытым кодом
В истинном духе TradingView, создатель этого скрипта сделал его открытым исходным кодом, чтобы трейдеры могли проверить и убедиться в его функциональности. Браво автору! Вы можете использовать его бесплатно, но помните, что перепубликация кода подчиняется нашим Правилам поведения.

Отказ от ответственности
Информация и публикации не предназначены для предоставления и не являются финансовыми, инвестиционными, торговыми или другими видами советов или рекомендаций, предоставленных или одобренных TradingView. Подробнее читайте в Условиях использования.
Скрипт с открытым кодом
В истинном духе TradingView, создатель этого скрипта сделал его открытым исходным кодом, чтобы трейдеры могли проверить и убедиться в его функциональности. Браво автору! Вы можете использовать его бесплатно, но помните, что перепубликация кода подчиняется нашим Правилам поведения.
Отказ от ответственности
Информация и публикации не предназначены для предоставления и не являются финансовыми, инвестиционными, торговыми или другими видами советов или рекомендаций, предоставленных или одобренных TradingView. Подробнее читайте в Условиях использования.