Обновлено
BTC CME Futures Gaps (BTCGapHunt_CME)
BTC CME Futures Gaps Indicator
Overview
This indicator visualises price gaps between the daily close and open of Bitcoin CME futures (CME:BTC1!). These gaps are often revisited ("filled") by market price action and may serve as technical targets.
Thanks
... to Maven and the Blockchain Masons (x.com/Masons_DAO) to push me on this topic.
What Is a CME Gap?
Key Features
Supported and Overrideable Parameters
How the Gap Size Is Calculated
Visual Guide
Alerts
Recommended Timeframes
How To Use
Notes
Disclaimer
This script is for educational purposes only. Trade at your own risk.
Overview
This indicator visualises price gaps between the daily close and open of Bitcoin CME futures (CME:BTC1!). These gaps are often revisited ("filled") by market price action and may serve as technical targets.
Thanks
... to Maven and the Blockchain Masons (x.com/Masons_DAO) to push me on this topic.
What Is a CME Gap?
- CME Bitcoin Futures do not trade 24/7. Gaps form when the market reopens at a different price than where it last closed.
- Gaps are often used as support/resistance or liquidity targets.
- This indicator tracks, visualises, and alerts on these gaps.
Key Features
- Automatic gap detection using daily open/close on CME:BTC1!
- Dynamic gap size threshold based on ATR (Average True Range)
- Highlight unfilled gaps and track partial fills visually
- Alerts for gap formation and fill events
- Parameter overlay showing real-time settings
Supported and Overrideable Parameters
- ATR Length: Defines the lookback period for ATR calculation (default: 14)
- Gap Size Multiplier: Multiplies the ATR to set the dynamic gap threshold (default: 1.0)
- Proximity Threshold: Price distance from gap edge to consider it filled (default: 100 USD)
- Max Gaps Tracked: Maximum number of concurrent gaps shown (default: 50)
- Alerts Enabled: Toggle alerts for gap formation and gap fill events
How the Gap Size Is Calculated
Minimum Gap Size = ATR(14) * Gap Size Multiplier
- ATR Length and Gap Size Multiplier are configurable.
- Gap threshold adjusts dynamically with market volatility.
Visual Guide
- Red Box: Fully unfilled gap
- Lemon Yellow Box: Partially filled gap
- Right Margin Boxes: Snapshot of unfilled gaps for quick access
- Top-Right Panel: Current ATR, Gap Size, Thresholds, etc.
Alerts
- Gap Formed: A new gap is detected.
- Gap Filled: The gap is either partially or fully filled.
Recommended Timeframes
- 1H, 4H, 1D (best resolution)
- Designed for BTC spot/perpetual charts (e.g., BTCUSD, BTCUSDT)
How To Use
- Add the script to your BTC chart.
- Monitor red/yellow boxes for unfilled gaps.
- Check config panel for current threshold and settings.
- Enable alerts via TradingView for real-time updates.
Notes
- Up to 50 gaps are tracked (adjustable).
- Data source: CME futures via request.security.
- All visuals and alerts are time-synced with your chart.
Disclaimer
This script is for educational purposes only. Trade at your own risk.
Информация о релизе
Changelog: BTC CME Futures Gaps Indicator (Enhanced)Version Enhancements
- Static Gap Size Option
Users can override ATR-based dynamic gap sizing with a static USD threshold.
New Parameters:- Use Static Gap Size (default: false)
- Static Gap Size (default: 100 USD)
- Improved Visual Filtering
Gaps smaller than 0.01 USD are not shown, both in the chart and right margin. This reduces noise from insignificant gaps. - Robustness Enhancements
- Safe array access with boundary checks to avoid runtime errors.
- Improved cleanup when gaps are removed due to fill or threshold conditions.
- Increased stability when processing high bar counts.
- Dynamic UI Table Update
Now displays both dynamic (ATR-based) and static gap size values for clarity. - Performance Optimisation
Efficient array handling and early exit conditions improve runtime reliability and reduce overhead.
Impact Summary
- Greater user control over gap sensitivity.
- Cleaner chart visuals with fewer micro-gaps.
- More stable script behaviour under all conditions.
- Better transparency with enhanced parameter display.
Информация о релизе
Fixed issues on 4h and 1d, enabled by default manual gap size and use 250USD as relevant gap.Информация о релизе
Bugfix all time dimensionsИнформация о релизе
fix: Consistent appearance on 1h, 4h, 1dИнформация о релизе
Added far right located boxes to visualiye unfilled gaps in one placeИнформация о релизе
Fix certain rendering issuesИнформация о релизе
This indicator visualises price gaps between the prior session close and the next session open of Bitcoin CME futures (CME:BTC1!), across two time dimensions — daily and a higher timeframe (weekly by default, monthly optional). These gaps are frequently revisited ("filled") by price and are widely used as technical targets, support/resistance, and liquidity levels. The script detects, draws, tracks fills, and alerts on them — and only renders on charts where CME gaps are actually meaningful.What Is a CME Gap?
Bitcoin CME futures do not trade 24/7. When the market reopens at a different price than where it last closed — most notably over the weekend — a gap is left on the chart. Because spot BTC keeps trading around the clock, price often returns to "fill" these gaps, which is why traders watch them as targets and S/R zones.
Key Features
Multi-timeframe detection — daily + a higher timeframe (weekly default, switchable to monthly), each with its own zones, labels, alerts and open-gap count.
Non-repainting source — the prior session close is read with the confirmed close[1] + lookahead pattern from CME:BTC1!, so historical gaps don't repaint.
Edge-based fill model — a gap fills toward the prior-close edge. The zone shrinks as price eats into it (partial fill) and is removed once price reaches the prior close (full fill). Fills use wicks (high/low) and never "un-fill".
Smart market detection — renders only on BTC charts quoted in USD or a USD stablecoin (USD / USDT / USDC, plus BUSD / DAI / TUSD / USDP / USDD / FDUSD). Fiat and stablecoins are treated as equivalent. On any other market it shows a notice instead of drawing misleading levels (with an override toggle if needed).
Dynamic or static threshold — filter gaps by an ATR-based size or a fixed USD amount.
Right-margin summary boxes — all open gaps gathered at the current price for quick reference, each labelled with its remaining size.
Status panel — source symbol, threshold, and live count of open gaps per timeframe.
Alerts — gap formation, partial fill, and full fill.
Configurable CME source (default CME:BTC1!) with a clear "no data" notice if the feed isn't available on your plan.
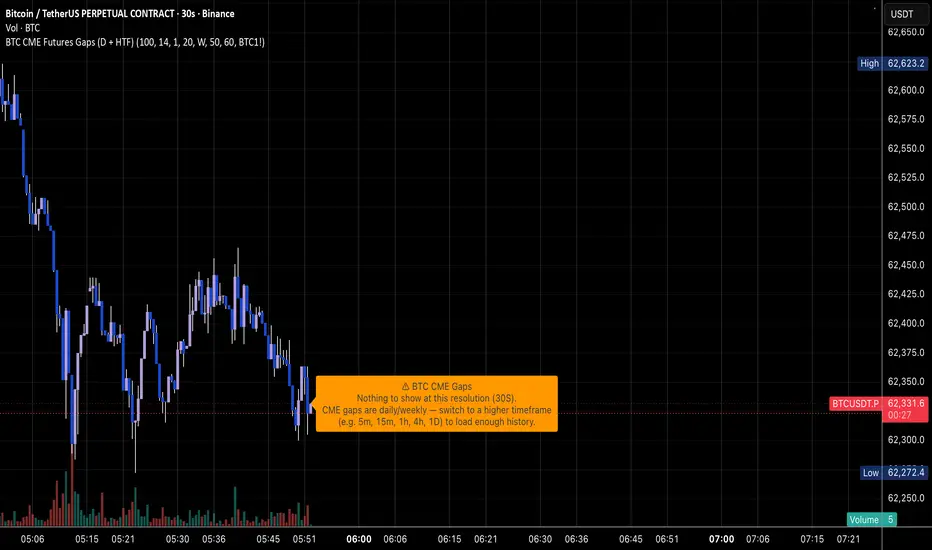
Low-timeframe guard — on sub-minute charts (e.g. 30s) too little history loads for daily/weekly gaps, so the indicator prompts you to switch to a higher timeframe instead of showing a blank chart.
Parameters
Use static gap size / Static min gap size (USD) — fixed threshold (default: on, 100 USD)
ATR length / ATR multiplier — dynamic threshold = ATR × multiplier (default: 14, 1.0)
Max gaps to track (per timeframe) — default: 20
Track daily gaps / Daily color (default: red)
Track higher-timeframe gaps / Higher timeframe (W or M) / Color (default: weekly, blue)
Alerts — formation / partial fill / full fill (individual toggles)
CME source symbol — default: CME:BTC1!
Override market check — force render on any chart (default: off)
Projection offset and low-timeframe threshold (sec) — display tuning
How the Gap Size Is Calculated
Static mode (default): Minimum Gap Size = your fixed USD value.
Dynamic mode: Minimum Gap Size = ATR(length) × multiplier — adapts to volatility.
Gaps below the threshold (and sub-tick gaps) are ignored to cut noise.
How a Gap Fills
A gap is the empty band between the prior session close and the next session open.
Gap up (opened above prior close): fills as price trades back down to the prior close.
Gap down (opened below prior close): fills as price trades back up to the prior close.
Partial fill = price first enters the band; the box shrinks toward the prior close. Full fill = price reaches the prior-close edge; the box is removed and an alert fires. The zone only ever shrinks — a retrace does not re-open it.
Visual Guide
Red box: open (unfilled) daily gap.
Blue box: open (unfilled) higher-timeframe gap.
A box that has shrunk is a partially filled gap (it shrinks toward the prior-close edge as it fills).
Right-margin boxes: snapshot of every open gap at the current price, labelled with remaining size.
Top-right panel: source symbol, threshold, and open-gap counts per timeframe.
Recommended Timeframes
5m, 15m, 1H, 4H, 1D all work well.
Avoid sub-minute (e.g. 30s) — too little history loads for daily/weekly gaps to appear; the indicator will say so and suggest a higher timeframe.
Apply to a BTC chart quoted in USD / USDT / USDC (spot, perpetual, or the CME contract itself).
How To Use
Add the script to a BTC/USD(T/C) chart on a 5m–1D timeframe.
Watch red (daily) and blue (higher-timeframe) boxes for open gaps.
Use the right-margin boxes to see all open gaps at a glance.
Create TradingView alerts for formation / partial fill / full fill.
Notes
Default 20 gaps tracked per timeframe (adjustable).
Data source: CME futures via request.security (symbol configurable).
CME:BTC1! is a continuous front-month contract; on roll days a contract change can briefly resemble a gap — the size filter hides most of it.
All visuals and alerts are time-synced with your chart.
Disclaimer
For educational purposes only. Trade at your own risk.
RELEASE NOTES
Jun 19, 2026 — Major update: v6 rewrite, multi-timeframe, corrected fill engine
Multi-timeframe gaps: added a higher-timeframe dimension (weekly default, monthly option) alongside daily — each with its own zones, labels, alerts and open-gap count.
New fill model: gaps now fill toward the prior-close edge. Partial fill when price enters the band (the zone shrinks); full fill when price reaches the prior close (zone removed, alert fired). This replaces the previous logic, where the partial-fill path could never trigger and a gap was removed as soon as price grazed an edge. Partial fills are now shown by the zone shrinking rather than a colour change.
Removed the Proximity Threshold parameter — obsolete under edge-based fills.
Market gating: the indicator now renders only on BTC charts quoted in USD or a USD stablecoin (USD / USDT / USDC, plus BUSD / DAI / TUSD / USDP / USDD / FDUSD); fiat and stablecoins are treated as equivalent. On other markets it shows a notice instead of drawing misleading levels. An override toggle is available.
Configurable CME source symbol (default CME:BTC1!) with a clear "no data" notice when the feed isn't available.
Low-timeframe guard: on sub-minute charts (e.g. 30s) too little history loads for daily/weekly gaps, so a remark now prompts you to switch to a higher timeframe (threshold configurable).
Non-repainting source: the prior close uses the confirmed close[1] + lookahead pattern; gap date labels now use the actual prior-session close time.
Rendering fixes: set max_boxes_count to 500 (previously capped at the default 50), removed a duplicated right-margin projection block, and the projection now redraws once on the last bar.
Stability: internals migrated to Pine v6 user-defined types and methods, removing the parallel-array bookkeeping that could desync boxes and labels.

Отказ от ответственности
Информация и публикации не предназначены для предоставления и не являются финансовыми, инвестиционными, торговыми или другими видами советов или рекомендаций, предоставленных или одобренных TradingView. Подробнее читайте в Условиях использования.
Отказ от ответственности
Информация и публикации не предназначены для предоставления и не являются финансовыми, инвестиционными, торговыми или другими видами советов или рекомендаций, предоставленных или одобренных TradingView. Подробнее читайте в Условиях использования.