Italian physicist Galileo Galilei is usually credited with being the first to measure speed by considering the distance covered and the time it takes. Galileo defined speed as the distance covered during a period of time. In equation form, that is v = Δd / Δt where v is speed, Δd is change in distance, and Δt is change in time. The Greek symbol for delta, a triangle (Δ), means change.
Is the speed getting faster or slower?
Acceleration will be the answer, acceleration is defined as the rate of change of speed over a set period of time, meaning something is getting faster or slower. Mathematically expressed, acceleration denoted as a is a = Δv / Δt , where Δv is the change in speed and Δt is the change in time.
How to apply in trading
Lets think about Momentum, Rate of Return, Rate of Change all are calculated in almost same approach with Speed
Momentum measures change in price over a specified time period,
Rate of Change measures percent change in price over a specified time period,
Rate of Return measures the net gain or loss over a specified time period,
And Speed measures change in distance over a specified time period
So we may state that measuring the change in distance is also measuring the change in price over a specified time period which is length, hence
speed can be calculated as (source – source[length])/length and acceleration becomes (speed – speed[length])/length
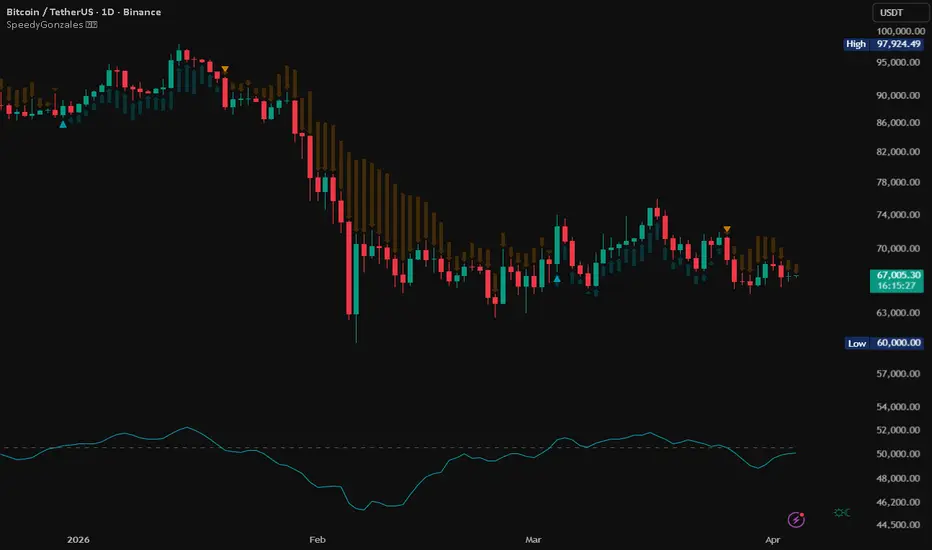
In this study acceleration is used as signal line and result plotted as arrows demonstrating bull or bear direction where direction changes can be considered as trading setups
Just a little fun, since we deal with speed the short name of the study is named after famous cartoon character Speedy Gonzales
Trading success is all about following your trading strategy and the indicators should fit within your trading strategy, and not to be traded upon solely
Disclaimer: The script is for informational and educational purposes only. Use of the script does not constitutes professional and/or financial advice. You alone the sole responsibility of evaluating the script output and risks associated with the use of the script. In exchange for using the script, you agree not to hold dgtrd TradingView user liable for any possible claim for damages arising from any decision you make based on use of the script
Is the speed getting faster or slower?
Acceleration will be the answer, acceleration is defined as the rate of change of speed over a set period of time, meaning something is getting faster or slower. Mathematically expressed, acceleration denoted as a is a = Δv / Δt , where Δv is the change in speed and Δt is the change in time.
How to apply in trading
Lets think about Momentum, Rate of Return, Rate of Change all are calculated in almost same approach with Speed
Momentum measures change in price over a specified time period,
Rate of Change measures percent change in price over a specified time period,
Rate of Return measures the net gain or loss over a specified time period,
And Speed measures change in distance over a specified time period
So we may state that measuring the change in distance is also measuring the change in price over a specified time period which is length, hence
speed can be calculated as (source – source[length])/length and acceleration becomes (speed – speed[length])/length
In this study acceleration is used as signal line and result plotted as arrows demonstrating bull or bear direction where direction changes can be considered as trading setups
Just a little fun, since we deal with speed the short name of the study is named after famous cartoon character Speedy Gonzales
Trading success is all about following your trading strategy and the indicators should fit within your trading strategy, and not to be traded upon solely
Disclaimer: The script is for informational and educational purposes only. Use of the script does not constitutes professional and/or financial advice. You alone the sole responsibility of evaluating the script output and risks associated with the use of the script. In exchange for using the script, you agree not to hold dgtrd TradingView user liable for any possible claim for damages arising from any decision you make based on use of the script
Информация о релизе
add ons;1-momentum acceleration concept applied to On Balance Volume to add insight for volume changes
2-volume histogram added
3-alert condition added
enhanced to a non-repaint version
Информация о релизе
backtest ability added
non-repaint version made optional (default repaint version)
Информация о релизе
exit price calculation error fixed when stop loss condition meetsmany many thanks for your highly valuable comments sotiri 🙏
Информация о релизе
removed "Enable Non-repaint Version" option and made Alerts and BackTest Non-RepaintИнформация о релизе
Enhancements in BackTest Framework1-) Historical Data Evaluation
in the real-time processing when the condition is satisfied to avoid repainting the signals are presented on the next bar, this feature was already available with this study
change implemented with this update is to made historical data evaluation behavior same as real-time behavior and all plottings, statistical panel calculations are performed based on the next bar
Hence;
- traders will observe the same behavior both in real-time and in historical bars (even when the study is reloaded)
- trade statistics will display whatever the user traded on the real-time bars with the signals generated
- since the signals are generated on the next bar, “Entry/Exit Price Assumption” input necessity is no longer required, trades with the backtest framework will be assumed as open price on the next candle
2-) Early Warning : Alert + Label
As a rule as explained above, signals are triggered on the next bar in case the condition is still valid and the logic of the study is already aware of the likelihood of an signal occurrence on the next bar but the trader who is analyzing the chart is not (according to this study’s logic of course). So to increase the awareness, with this update ;
- a label with a warning sign is going to be plotted which of course is subject to repaint but will warn the trader to keep eyes closer on the instrument and proceed trading immediately on the next bar if the signal is confirmed and presented on the chart.
- for the same warning also an alert is defined (using new alert() function call), so the trader will be able to be notified with the probable not yet confirmed trade opportunity in advance, even if the trader is not monitoring the instrument.
Having said that, I would like to remind : Trading success is all about following your trading strategy and the indicators should fit within your trading strategy, and not to be traded upon solely.
3-) Improved Conditions
Avoid Sudden Price Changes : Since the long/short conditions are triggered on next bar there might be cases where a sudden change in price direction and hence signal change may occur especially in sideway market conditions with low volatility, this option is to avoid such cases
Candle Direction as Confirmation : confirms signal if the candle formation is in favor of the trade
Please note : selecting the above options will cause the signals to be executed on the second bar so to have the study non-repaint. For test purposes only you may enable "❗❗❗ Simulate Trade on Next Bar : Only For Test Purpose (REPAINTS)" option to simulate the trade on the next bar.
Important note : stop loss condition will be executed when price fall below the calculated value and trade will be closed with the close price on bar close (not yet able to get the price value at the moment of the cross). Stop loss condition is subject to repainting and to avoid any further loss an alert can be triggered at the moment the first cross is observed. Since stop loss is subject to repaint and in case it happens the statistical panel calculation will not be able to calculate till the bar is closed. You may disable application of stop loss from user dialog box to avoid any inconsistency that may appear on statistical panel and observe results of the trades executed without stop loss.
Other updates in Study
• Enhanced Alerts setup to have two alerts settings for bull condition and two for bear condition, one with the repaint version (early warning) and one non-repaint version (on the next bar if still condition holds true).
Информация о релизе
* momentum accelaration source now can be selected either price or on balance volume * improved on balance volume momentum accelaration oscilator display - now available for all timeframes on both log and linear scale
plus added option to display price momentum accelaration oscilator view
Информация о релизе
Core ConceptMomentum Acceleration evaluates how quickly price or volume dynamics are changing.
Instead of reacting to trend after it forms, the engine focuses on:
• Acceleration of movement
• Early transition phases
• Momentum exhaustion zones
• Confirmation of directional intent
This allows traders to detect opportunities earlier than standard momentum tools.
Key Features
• Momentum Acceleration Engine (Price or OBV based)
• Early Warning and Confirmation Signals
• Arrow Visualization with Directional Markers
• Oscillator Projection View (Price & OBV overlays)
• Integrated Backtest Framework with statistics
• Optional Stop Loss and trade filters
• Trade simulation labels and performance tracking
Backtest Framework
The built-in framework allows users to:
• Simulate trades directly on chart
• Evaluate strategy behavior over time
• Observe win ratio and capital evolution
• Test confirmation filters and stop loss logic
This makes the tool suitable for both discretionary traders and system developers.
How to Use
Typical workflow:
• Acceleration crossing above zero → Potential bullish phase
• Acceleration crossing below zero → Potential bearish phase
• Early warnings appear before confirmation signals
• Use higher timeframe context for stronger reliability
Best results are often achieved when combined with structure, trend, or liquidity tools.
Notes
This indicator is designed as a decision-support tool and should be used within a broader trading framework.
☼☾ SoleMare Analytics
Информация о релизе
Backtest Framework — UpdateShort trade support
The framework now simulates both long and short trades. A new Trade Mode selector (Long Only / Short Only / Both) controls which directions are active. In Long Only mode the short signal acts as the exit, and vice versa — no separate exit signal needed.
Reverse on signal
When Trade Mode is set to Both, an optional Reverse on Opposite Signal toggle immediately closes the current trade and opens one in the other direction on the opposite signal — keeping the simulation always in trade once started. When disabled, the opposite signal exits only and waits for the next confirmed entry.
Stop loss improvements
Stop loss now uses intrabar high/low rather than close-based crossover detection. This catches wicks that breach the stop level during the bar without closing at or beyond it — a more realistic simulation of how stops are actually triggered.
Early warning labels
The ⚠️ early warning system now covers both long and short signals, gated independently on the Trade Mode setting. Each warning is displayed on the signal bar and automatically removed on the following bar.
Statistics label
Win/loss breakdown is now shown separately for long and short trades, giving a clearer picture of directional edge. Unrealized PnL, current stop loss level, and trade status are included when a trade is active.
Скрипт с открытым кодом
В истинном духе TradingView, создатель этого скрипта сделал его открытым исходным кодом, чтобы трейдеры могли проверить и убедиться в его функциональности. Браво автору! Вы можете использовать его бесплатно, но помните, что перепубликация кода подчиняется нашим Правилам поведения.

SoleMare Analytics | MarketMastery™ Tools | Exclusively on TradingView
Отказ от ответственности
Информация и публикации не предназначены для предоставления и не являются финансовыми, инвестиционными, торговыми или другими видами советов или рекомендаций, предоставленных или одобренных TradingView. Подробнее читайте в Условиях использования.
Скрипт с открытым кодом
В истинном духе TradingView, создатель этого скрипта сделал его открытым исходным кодом, чтобы трейдеры могли проверить и убедиться в его функциональности. Браво автору! Вы можете использовать его бесплатно, но помните, что перепубликация кода подчиняется нашим Правилам поведения.
Отказ от ответственности
Информация и публикации не предназначены для предоставления и не являются финансовыми, инвестиционными, торговыми или другими видами советов или рекомендаций, предоставленных или одобренных TradingView. Подробнее читайте в Условиях использования.