Hour Stats [NQ Stats x CantoLab]
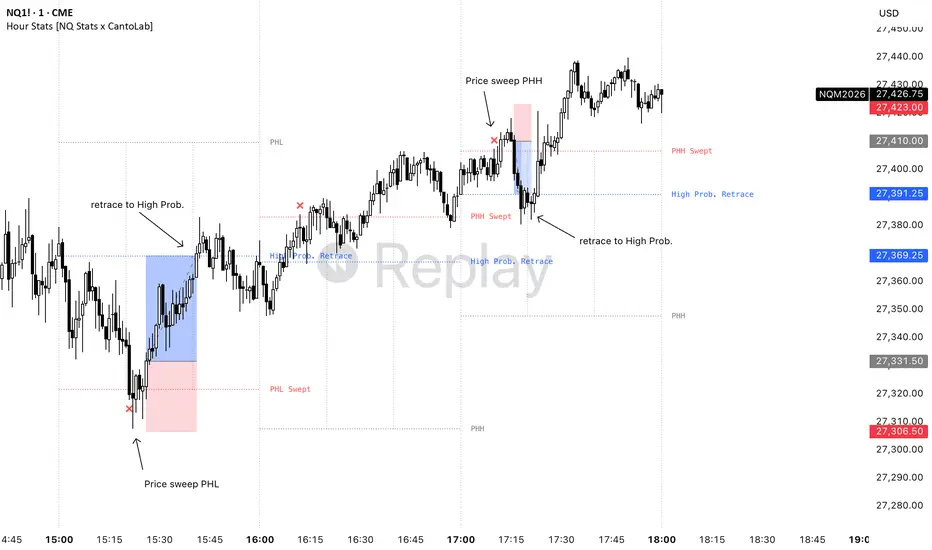
A statistical tool for NQ intraday traders built around research from NQ Stats (NQStats on twitter / nqstats.com). Credit to NQ Stats for the original concept and data — published here as an open source indicator with permission.
What it does?
For each New York session hour (08:00 – 16:00 NY time), the indicator tracks a specific setup:
1)Price opens strictly inside the prior hour's range
2)Price breaches the prior hour high or low by at least 1 tick (0.25 pts)
3)Whether price reverts back to the current hour open before the hour closes
Only the first breach per hour is counted. Reversion is confirmed when any bar's wick touches or crosses the hour open after the breach occurs.
What gets plotted
When the setup triggers, the indicator draws the following levels for that hour:
Simple vs Advanced mode
Simple — shows Hour Open, swept level, and opposite target. Clean and uncluttered for execution focus.
Advanced — adds the Prior Hour Mid level and overlays per-segment reversion probabilities directly on the prior hour high and low, showing the statistical likelihood of reversion depending on when in the hour the breach occurs.
Advanced Mode - The 20-minute breakdown
Each hour is divided into three 20-minute windows (00–20, 20–40, 40–60). The timing of the breach within these windows significantly affects reversion probability.
As a general rule, first segment breaches carry the highest probability of reversion — the 09:00 hour first segment sits at 87.4% historically. Probabilities are pulled from 10 years of NQ data.
Settings
Notes
What it does?
For each New York session hour (08:00 – 16:00 NY time), the indicator tracks a specific setup:
1)Price opens strictly inside the prior hour's range
2)Price breaches the prior hour high or low by at least 1 tick (0.25 pts)
3)Whether price reverts back to the current hour open before the hour closes
Only the first breach per hour is counted. Reversion is confirmed when any bar's wick touches or crosses the hour open after the breach occurs.
What gets plotted
When the setup triggers, the indicator draws the following levels for that hour:
- Hour Open — the high probability reversion target. In Simple mode labelled as "High Prob. Retrace", in Advanced mode shows the statistical probability based on which 20-minute segment the breach occurred in
- PHH / PHL Swept — marks the breached prior hour high or low
- PHH / PHL Target — the opposite side of the prior hour range, the secondary target if reversion extends further
- PHM (Prior Hour Mid) — the equilibrium of the prior hour range, visible in Advanced mode only
- Sweep Mark — a small shape plotted on the candle where the breach is first detected (x, +, or diamond, configurable)
- Vertical dividers — split each hour into its three 20-minute segments
Simple vs Advanced mode
Simple — shows Hour Open, swept level, and opposite target. Clean and uncluttered for execution focus.
Advanced — adds the Prior Hour Mid level and overlays per-segment reversion probabilities directly on the prior hour high and low, showing the statistical likelihood of reversion depending on when in the hour the breach occurs.
Advanced Mode - The 20-minute breakdown
Each hour is divided into three 20-minute windows (00–20, 20–40, 40–60). The timing of the breach within these windows significantly affects reversion probability.
As a general rule, first segment breaches carry the highest probability of reversion — the 09:00 hour first segment sits at 87.4% historically. Probabilities are pulled from 10 years of NQ data.
Settings
- Mode — Simple or Advanced
- Show History — keep or clear previous setups as new ones form
- Time Filter — toggle NY session filter on/off, adjustable session window
- Show Optimal Timeframe Message — on-chart warning if you are above 5min timeframe
- Per-level toggles — color, style (Solid/Dotted/Dashed) and width for each plotted level
- Sweep Mark — toggle, color, and shape
Notes
- Built for NQ Futures. Behaviour on other instruments is untested
- Best used on 1m – 5min timeframes. Warning displays above 5min, error displays at 60min and above
- All times are New York time
- Probability data is derived from 10 years of NQ historical data by nqstats
- This indicator does not provide financial advice or a complete strategy. You are responsible for how you build around and execute on this data

Отказ от ответственности
Информация и публикации не предназначены для предоставления и не являются финансовыми, инвестиционными, торговыми или другими видами советов или рекомендаций, предоставленных или одобренных TradingView. Подробнее читайте в Условиях использования.
Отказ от ответственности
Информация и публикации не предназначены для предоставления и не являются финансовыми, инвестиционными, торговыми или другими видами советов или рекомендаций, предоставленных или одобренных TradingView. Подробнее читайте в Условиях использования.