OPEN-SOURCE SCRIPT
Margin Debt to M2 Ratio
█ OVERVIEW
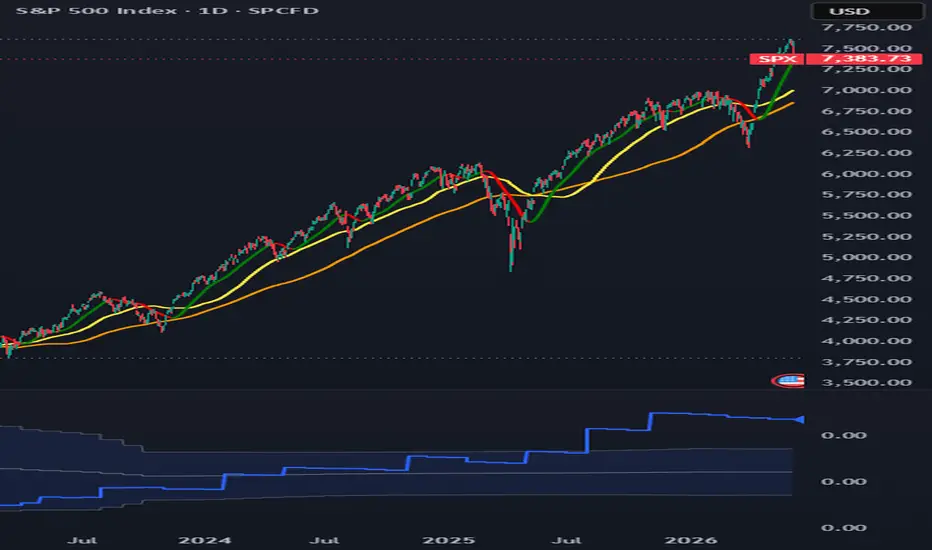
Plots customer margin debt divided by the M2 money stock, expressed as a percent, in a separate pane, with a standard deviation band around its mean. Normalizing margin debt by the broad money supply removes the secular growth the raw series accrues through inflation and monetary expansion, so leverage readings are comparable across decades rather than trending upward by construction.
█ HISTORY / BACKGROUND
Aggregate customer margin debt has long been followed as a gauge of speculative leverage and risk appetite. The statistic is published monthly by FINRA, and previously by the NYSE for member firms. Reading the raw dollar figure across long spans is misleading because it rises with the size of the economy and the money supply regardless of relative leverage. Dividing margin debt by M2 is a normalization that expresses borrowing against the monetary base, isolating changes in leverage intensity from growth in the quantity of money. The approach is a normalization technique rather than a named proprietary system. Its conceptual basis is that relative leverage, not the nominal dollar level, carries the sentiment information.
█ HOW IT WORKS
The script requests two series at monthly resolution, forms their ratio, and derives a mean and a standard deviation band from the monthly history.
1. Margin debt is requested with request.security at the 1M timeframe using the closing value of the symbol set in the first input. M2 is requested the same way from the second input.
2. The ratio is computed as margin debt divided by the quantity (M2 multiplied by 1000), then multiplied by 100. The factor of 1000 reconciles units, because the default margin debt series is reported in millions of dollars and M2 in billions. The factor of 100 expresses the result as a percent. When either series is na, or when M2 is zero, the ratio is na.
3. One ratio observation is appended to a persistent array on each new calendar month, detected with a change in the monthly time value. Computing the statistics from this array rather than from chart bars keeps them correct on any chart resolution, because forward filled monthly values on a lower timeframe do not inflate the sample.
4. On each new month the band statistics are recomputed. The window is the entire array in full sample mode, or the trailing number of months given by the lookback input in rolling mode. The mean is the arithmetic average over the window. The standard deviation is the sample deviation, computed as the square root of the summed squared deviations from the mean divided by the window length minus one, and is na until at least two observations exist.
5. The upper and lower band lines are the mean plus and minus the sigma multiplier times the standard deviation.
█ HOW TO USE
The script is built for the monthly timeframe. The underlying data is monthly for M2 and quarterly for the margin debt proxy, and the statistics are accumulated per calendar month, so 1M is the resolution at which the display matches the data cadence. On an intraday chart the script draws a warning label and the band should not be read at that resolution.
Visual elements:
• The blue line is the margin debt to M2 ratio in percent.
• The shaded band spans the mean plus and minus the chosen sigma multiple.
• The gray midline is the mean, when enabled.
• The label at the last bar prints the current ratio to two decimals.
Readings above the upper band indicate leverage that is high relative to the money supply. Readings below the lower band indicate depressed leverage, typically following a deleveraging episode. This is a slow moving macro context series, not a timing trigger. An alert condition fires when the ratio reaches or exceeds the upper band.
█ SETTINGS
• Margin debt series: the symbol used as the numerator. Default FRED:BOGZ1FL663067003Q.
• M2 money stock: the symbol used as the denominator. Default FRED:M2SL.
• Band mode: selects Rolling (point-in-time), which uses a trailing window, or Full sample (lookahead), which uses the entire history. Default Rolling (point-in-time).
• Rolling lookback (months): the trailing window length used in rolling mode. Default 180, minimum 12.
• Sigma multiplier: the number of standard deviations for the band width. Default 1.0, minimum 0.25, step 0.25.
• Show mean midline: toggles the mean line. Default on.
• Show current value label: toggles the last bar value label. Default on.
█ WHAT MAKES IT ORIGINAL
The script normalizes margin debt by M2 and presents the result in a dedicated pane with an explicit standard deviation band, rather than overlaying a rate of change or a z score of the raw series on price. Two design choices distinguish the implementation. First, the band can be computed either as a trailing point-in-time window or as a fixed full sample band, and the full sample option is labeled as containing lookahead, so the distinction is explicit rather than hidden in the output. Second, the band statistics are accumulated from one observation per calendar month held in an array, which makes the mean and standard deviation independent of the chart timeframe and avoids the understated deviation that results when forward filled monthly values are sampled on a lower timeframe.
█ NOTES / LIMITATIONS
• Symbol resolution: both inputs ignore invalid symbols. If a symbol does not resolve or returns na, or if M2 is zero, the ratio is na and neither the line nor the band renders. No runtime error is raised.
• Unit assumption: the ratio applies a fixed factor of 1000 to reconcile a numerator in millions against a denominator in billions. Replacing the default symbols with series in other units breaks the percent scaling.
• Data cadence: the default margin debt proxy is quarterly and M2 is monthly, so the ratio holds the most recent quarterly margin debt value across the intervening months.
• Provenance: TradingView does not carry the FINRA monthly margin debt statistic as a native symbol. The default numerator is the Federal Reserve Z.1 series for margin accounts at brokers and dealers, a close substitute that differs in level and cadence from the FINRA figure.
• Lookahead: only the Full sample band mode uses future observations in its statistics and is therefore not point-in-time. Rolling mode does not. The request.security calls use the default non lookahead behavior.
• Timeframe: the logic is intended for 1M. On intraday charts a warning label is drawn and the band should not be read.
• History dependence: the band requires accumulated monthly observations to populate. Early in available history, or on symbols with short history, the standard deviation is na until at least two monthly observations exist and stabilizes only after the lookback window fills.
█ THANKS
Chart concept surfaced by the Stacked Insights YouTube channel. Margin debt data originates with FINRA and the Federal Reserve. M2 originates with the Board of Governors of the Federal Reserve System.
Plots customer margin debt divided by the M2 money stock, expressed as a percent, in a separate pane, with a standard deviation band around its mean. Normalizing margin debt by the broad money supply removes the secular growth the raw series accrues through inflation and monetary expansion, so leverage readings are comparable across decades rather than trending upward by construction.
█ HISTORY / BACKGROUND
Aggregate customer margin debt has long been followed as a gauge of speculative leverage and risk appetite. The statistic is published monthly by FINRA, and previously by the NYSE for member firms. Reading the raw dollar figure across long spans is misleading because it rises with the size of the economy and the money supply regardless of relative leverage. Dividing margin debt by M2 is a normalization that expresses borrowing against the monetary base, isolating changes in leverage intensity from growth in the quantity of money. The approach is a normalization technique rather than a named proprietary system. Its conceptual basis is that relative leverage, not the nominal dollar level, carries the sentiment information.
█ HOW IT WORKS
The script requests two series at monthly resolution, forms their ratio, and derives a mean and a standard deviation band from the monthly history.
1. Margin debt is requested with request.security at the 1M timeframe using the closing value of the symbol set in the first input. M2 is requested the same way from the second input.
2. The ratio is computed as margin debt divided by the quantity (M2 multiplied by 1000), then multiplied by 100. The factor of 1000 reconciles units, because the default margin debt series is reported in millions of dollars and M2 in billions. The factor of 100 expresses the result as a percent. When either series is na, or when M2 is zero, the ratio is na.
3. One ratio observation is appended to a persistent array on each new calendar month, detected with a change in the monthly time value. Computing the statistics from this array rather than from chart bars keeps them correct on any chart resolution, because forward filled monthly values on a lower timeframe do not inflate the sample.
4. On each new month the band statistics are recomputed. The window is the entire array in full sample mode, or the trailing number of months given by the lookback input in rolling mode. The mean is the arithmetic average over the window. The standard deviation is the sample deviation, computed as the square root of the summed squared deviations from the mean divided by the window length minus one, and is na until at least two observations exist.
5. The upper and lower band lines are the mean plus and minus the sigma multiplier times the standard deviation.
█ HOW TO USE
The script is built for the monthly timeframe. The underlying data is monthly for M2 and quarterly for the margin debt proxy, and the statistics are accumulated per calendar month, so 1M is the resolution at which the display matches the data cadence. On an intraday chart the script draws a warning label and the band should not be read at that resolution.
Visual elements:
• The blue line is the margin debt to M2 ratio in percent.
• The shaded band spans the mean plus and minus the chosen sigma multiple.
• The gray midline is the mean, when enabled.
• The label at the last bar prints the current ratio to two decimals.
Readings above the upper band indicate leverage that is high relative to the money supply. Readings below the lower band indicate depressed leverage, typically following a deleveraging episode. This is a slow moving macro context series, not a timing trigger. An alert condition fires when the ratio reaches or exceeds the upper band.
█ SETTINGS
• Margin debt series: the symbol used as the numerator. Default FRED:BOGZ1FL663067003Q.
• M2 money stock: the symbol used as the denominator. Default FRED:M2SL.
• Band mode: selects Rolling (point-in-time), which uses a trailing window, or Full sample (lookahead), which uses the entire history. Default Rolling (point-in-time).
• Rolling lookback (months): the trailing window length used in rolling mode. Default 180, minimum 12.
• Sigma multiplier: the number of standard deviations for the band width. Default 1.0, minimum 0.25, step 0.25.
• Show mean midline: toggles the mean line. Default on.
• Show current value label: toggles the last bar value label. Default on.
█ WHAT MAKES IT ORIGINAL
The script normalizes margin debt by M2 and presents the result in a dedicated pane with an explicit standard deviation band, rather than overlaying a rate of change or a z score of the raw series on price. Two design choices distinguish the implementation. First, the band can be computed either as a trailing point-in-time window or as a fixed full sample band, and the full sample option is labeled as containing lookahead, so the distinction is explicit rather than hidden in the output. Second, the band statistics are accumulated from one observation per calendar month held in an array, which makes the mean and standard deviation independent of the chart timeframe and avoids the understated deviation that results when forward filled monthly values are sampled on a lower timeframe.
█ NOTES / LIMITATIONS
• Symbol resolution: both inputs ignore invalid symbols. If a symbol does not resolve or returns na, or if M2 is zero, the ratio is na and neither the line nor the band renders. No runtime error is raised.
• Unit assumption: the ratio applies a fixed factor of 1000 to reconcile a numerator in millions against a denominator in billions. Replacing the default symbols with series in other units breaks the percent scaling.
• Data cadence: the default margin debt proxy is quarterly and M2 is monthly, so the ratio holds the most recent quarterly margin debt value across the intervening months.
• Provenance: TradingView does not carry the FINRA monthly margin debt statistic as a native symbol. The default numerator is the Federal Reserve Z.1 series for margin accounts at brokers and dealers, a close substitute that differs in level and cadence from the FINRA figure.
• Lookahead: only the Full sample band mode uses future observations in its statistics and is therefore not point-in-time. Rolling mode does not. The request.security calls use the default non lookahead behavior.
• Timeframe: the logic is intended for 1M. On intraday charts a warning label is drawn and the band should not be read.
• History dependence: the band requires accumulated monthly observations to populate. Early in available history, or on symbols with short history, the standard deviation is na until at least two monthly observations exist and stabilizes only after the lookback window fills.
█ THANKS
Chart concept surfaced by the Stacked Insights YouTube channel. Margin debt data originates with FINRA and the Federal Reserve. M2 originates with the Board of Governors of the Federal Reserve System.
Скрипт с открытым кодом
В истинном духе TradingView, создатель этого скрипта сделал его открытым исходным кодом, чтобы трейдеры могли проверить и убедиться в его функциональности. Браво автору! Вы можете использовать его бесплатно, но помните, что перепубликация кода подчиняется нашим Правилам поведения.

Отказ от ответственности
Информация и публикации не предназначены для предоставления и не являются финансовыми, инвестиционными, торговыми или другими видами советов или рекомендаций, предоставленных или одобренных TradingView. Подробнее читайте в Условиях использования.
Скрипт с открытым кодом
В истинном духе TradingView, создатель этого скрипта сделал его открытым исходным кодом, чтобы трейдеры могли проверить и убедиться в его функциональности. Браво автору! Вы можете использовать его бесплатно, но помните, что перепубликация кода подчиняется нашим Правилам поведения.
Отказ от ответственности
Информация и публикации не предназначены для предоставления и не являются финансовыми, инвестиционными, торговыми или другими видами советов или рекомендаций, предоставленных или одобренных TradingView. Подробнее читайте в Условиях использования.