OPEN-SOURCE SCRIPT
12 Weeks View [by Roman]
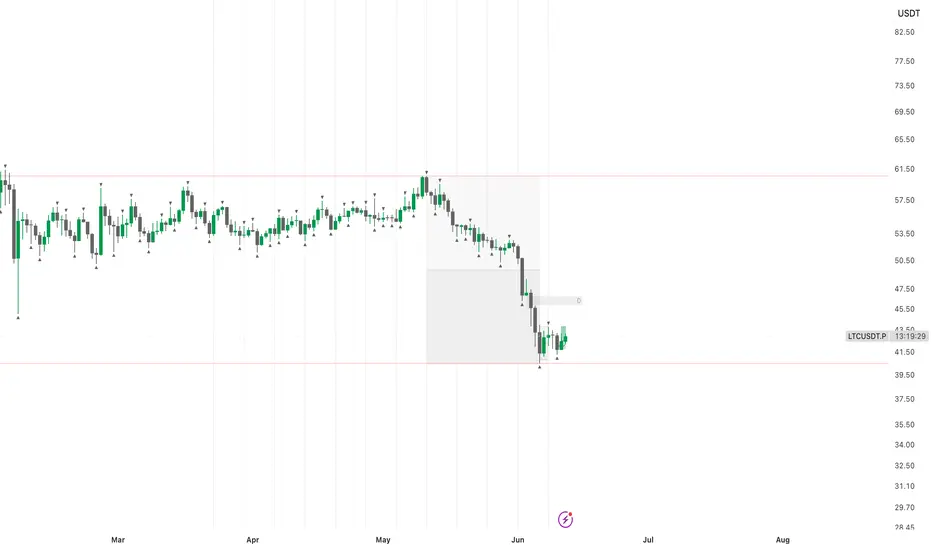
A clean market structure indicator designed for traders who focus on liquidity, key levels, and higher-timeframe context.
Features
Why Use It?
The highest and lowest points of the last 12 weeks often act as significant liquidity pools and major support/resistance levels. These areas are frequently referenced by:
The weekly separators provide clear temporal context, helping traders identify:
Controls the color of the weekly separator lines.
Best Used For
This indicator is intentionally minimalistic, providing only the most relevant weekly structure information without cluttering the chart.
Features
- Weekly Start Markers
- Draws vertical lines at the beginning of each week.
- Displays only the most recent 12 weeks to keep the chart clean.
- Weekly line color is fully customizable.
- 12-Week Extreme Levels
- Calculates the highest high from the previous 12 completed weeks.
- Calculates the lowest low from the previous 12 completed weeks.
- Displays a single horizontal level for each extreme.
- High and Low line colors can be customized independently.
Why Use It?
The highest and lowest points of the last 12 weeks often act as significant liquidity pools and major support/resistance levels. These areas are frequently referenced by:
- Smart Money Concept (SMC) traders
- ICT traders
- Swing traders
- Position traders
- Market structure analysts
The weekly separators provide clear temporal context, helping traders identify:
- Weekly range development
- Liquidity sweeps
- Breakouts from multi-week consolidation
- Reactions at major higher-timeframe levels
- Settings
- Weekly Start Line Color
Controls the color of the weekly separator lines.
Best Used For
- Cryptocurrency markets
- Forex markets
- Indices
- Stocks
- Multi-timeframe analysis
This indicator is intentionally minimalistic, providing only the most relevant weekly structure information without cluttering the chart.
Скрипт с открытым кодом
В истинном духе TradingView, создатель этого скрипта сделал его открытым исходным кодом, чтобы трейдеры могли проверить и убедиться в его функциональности. Браво автору! Вы можете использовать его бесплатно, но помните, что перепубликация кода подчиняется нашим Правилам поведения.

Отказ от ответственности
Информация и публикации не предназначены для предоставления и не являются финансовыми, инвестиционными, торговыми или другими видами советов или рекомендаций, предоставленных или одобренных TradingView. Подробнее читайте в Условиях использования.
Скрипт с открытым кодом
В истинном духе TradingView, создатель этого скрипта сделал его открытым исходным кодом, чтобы трейдеры могли проверить и убедиться в его функциональности. Браво автору! Вы можете использовать его бесплатно, но помните, что перепубликация кода подчиняется нашим Правилам поведения.
Отказ от ответственности
Информация и публикации не предназначены для предоставления и не являются финансовыми, инвестиционными, торговыми или другими видами советов или рекомендаций, предоставленных или одобренных TradingView. Подробнее читайте в Условиях использования.