OPEN-SOURCE SCRIPT
Обновлено Mansfield RS+ - Relative Strength with Price Confirmation

Combines the Mansfield Relative Strength calculation (credit: stageanalysis) with a price action confirmation overlay (credit: bharatTrader) into a single indicator.
Calculation
The RS line measures daily stock price divided by weekly SPX close, normalized against a 52-week SMA of that ratio. Values above zero indicate outperformance vs. the S&P 500. Values below zero indicate underperformance.
Inputs
Reading the indicator
The zero line changes color based on RS momentum direction — green when RS is accelerating, red when decelerating.
Bubbles appear when price and its 50 SMA agree on direction. Green bubbles indicate price above a rising SMA. Red bubbles indicate price below a falling SMA.
RS above zero with green bubbles: RS and price both confirm, strongest long signal. RS above zero with red bubbles: RS positive but price weakening, use as a caution signal. RS below zero with green bubbles: price leading RS, early watch but not yet actionable. RS below zero with red bubbles: both confirm weakness, avoid.
Alerts included
Credits:
Mansfield RS formula: [url=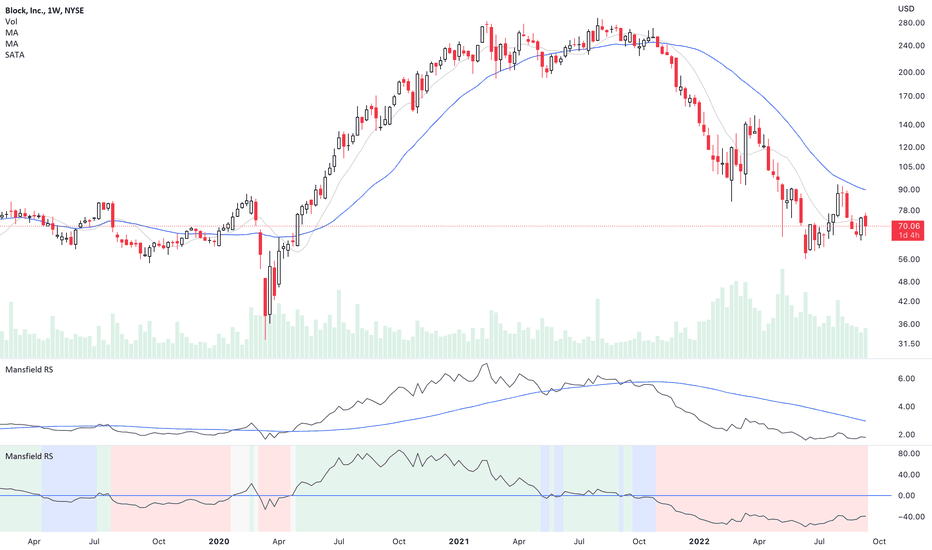
Price confirmation bubble logic: bharatTrader
Calculation
The RS line measures daily stock price divided by weekly SPX close, normalized against a 52-week SMA of that ratio. Values above zero indicate outperformance vs. the S&P 500. Values below zero indicate underperformance.
Inputs
- Symbol: benchmark index (default SP:SPX)
- MA Length: lookback period for the zero line SMA (default 52)
- Price Confirmation Period: SMA length for bubble logic (default 50)
- RS Trend Range: lookback for zero line momentum color (default 5)
- Show Bubbles: toggle price confirmation overlay
- Show Background Colors: toggle Mansfield-style background
Reading the indicator
The zero line changes color based on RS momentum direction — green when RS is accelerating, red when decelerating.
Bubbles appear when price and its 50 SMA agree on direction. Green bubbles indicate price above a rising SMA. Red bubbles indicate price below a falling SMA.
RS above zero with green bubbles: RS and price both confirm, strongest long signal. RS above zero with red bubbles: RS positive but price weakening, use as a caution signal. RS below zero with green bubbles: price leading RS, early watch but not yet actionable. RS below zero with red bubbles: both confirm weakness, avoid.
Alerts included
- RS crossed above/below zero
- RS trend turned bullish/bearish
Credits:
Mansfield RS formula: [url=
Price confirmation bubble logic: bharatTrader
Информация о релизе
Added configurable value label size and color override option. Reduced bubble size. Removed unused background color inputs.Информация о релизе
Bug fix to make it work on smaller time frames.Скрипт с открытым кодом
В истинном духе TradingView, создатель этого скрипта сделал его открытым исходным кодом, чтобы трейдеры могли проверить и убедиться в его функциональности. Браво автору! Вы можете использовать его бесплатно, но помните, что перепубликация кода подчиняется нашим Правилам поведения.

Отказ от ответственности
Информация и публикации не предназначены для предоставления и не являются финансовыми, инвестиционными, торговыми или другими видами советов или рекомендаций, предоставленных или одобренных TradingView. Подробнее читайте в Условиях использования.
Скрипт с открытым кодом
В истинном духе TradingView, создатель этого скрипта сделал его открытым исходным кодом, чтобы трейдеры могли проверить и убедиться в его функциональности. Браво автору! Вы можете использовать его бесплатно, но помните, что перепубликация кода подчиняется нашим Правилам поведения.
Отказ от ответственности
Информация и публикации не предназначены для предоставления и не являются финансовыми, инвестиционными, торговыми или другими видами советов или рекомендаций, предоставленных или одобренных TradingView. Подробнее читайте в Условиях использования.