OPEN-SOURCE SCRIPT
GammaRSI [MarketFragments]
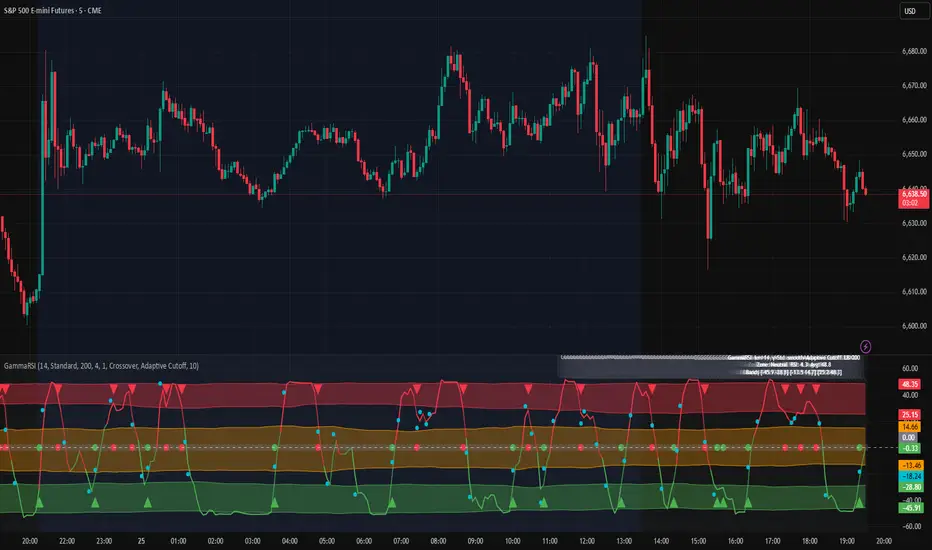
GammaRSI [MarketFragments]
A Laguerre RSI oscillator with three adaptive K-Means bands that
dynamically discover overbought and oversold zones from the RSI
values themselves -- replacing fixed static levels with data-driven
boundaries that adjust to the current instrument and regime.
The oscillator is re-centered around zero. Zero equals the K-Means
band equilibrium. Positive values mean RSI is above the band center.
Negative values mean RSI is below it. This makes the indicator
immediately readable regardless of what the raw RSI value is doing.
─────────────────────────────────────────────────────────────
HOW IT WORKS
─────────────────────────────────────────────────────────────
STEP 1 -- LAGUERRE RSI
The RSI is computed using the Laguerre filter, a four-pole recursive
smoother introduced by John Ehlers in Cybernetic Analysis for Stocks
and Futures. Unlike standard RSI which uses a fixed lookback average,
the Laguerre filter weights recent data through a damping coefficient
called gamma. The result is a smoother, lower-lag oscillator that
stays in overbought or oversold territory longer during genuine trends
and turns faster at reversals.
STEP 2 -- GAMMA CALCULATION (7 methods)
Gamma controls the filter sensitivity. Instead of setting it manually,
this indicator derives it from the market structure itself using one
of seven methods selectable by the user:
Standard Log ratio of cumulative true range to total price
range over the RSI length period. Classic fractal
energy -- the original Ehlers method.
Lanczos Applies the Lanczos gamma-function approximation
to the standard fractal energy value. Produces a
smoother fractional dimension estimate.
MultifractalQM Averages fractal dimensions computed at three
moment orders: q=1 (mean), q=2 (RMS), q=4
(fourth root). Captures multi-moment scaling
behavior of price movement.
MultifractalScale Computes fractal dimension at three time scales
(n, 2n, n/2) and averages them. Provides a
multi-scale view of self-similarity.
VolatilityGK Standard fractal energy scaled by the
Garman-Klass OHLC volatility estimator. Adjusts
gamma for realized volatility using open, high,
low, and close prices.
VolatilitySD Standard fractal energy scaled by the normalized
standard deviation of true range. Similar to GK
but uses a simpler volatility proxy.
Entropy Shannon entropy of the true range distribution
across 10 bins. High entropy = chaotic/ranging.
Low entropy = structured/trending. Gamma reflects
the informational complexity of price movement.
All gamma values are clamped to [0.1, 0.9] to keep the filter stable.
STEP 3 -- K-MEANS CLUSTERING ON RSI VALUES
Rather than clustering price, this indicator clusters the Laguerre RSI
output values themselves over a rolling lookback window. Three cluster
centroids are initialized at the 25th, 50th, and 75th percentile of
the recent RSI distribution. Each bar, all RSI values in the lookback
window are assigned to their nearest centroid. The intra-cluster
standard deviation is computed for each cluster and smoothed to form
the upper and lower band boundaries.
The result is three adaptive bands:
Low band (green) Natural oversold zone for this instrument
Mid band (orange) Neutral equilibrium zone
High band (red) Natural overbought zone for this instrument
These bands are not fixed at 70/30 or any static level. They reflect
where RSI has actually been oscillating over the lookback period.
STEP 4 -- OSCILLATOR TRANSFORM
RSI is subtracted from the average of the three centroids and scaled
by 100. This re-centers the oscillator around zero regardless of the
absolute RSI level, making the chart immediately readable.
STEP 5 -- SMOOTHING (optional)
Four Ehlers filter options are available to smooth the oscillator line:
Raw Unsmoothed -- fastest, most reactive
SuperSmoother Two-pole Ehlers filter -- smooth with low lag
Gaussian Gaussian-weighted smoother
Zero-Lag EMA EMA with lag compensation
Adaptive Cutoff SuperSmoother with volatility-scaled period
(default) -- adjusts smoothing to current noise
─────────────────────────────────────────────────────────────
SIGNAL MODES
─────────────────────────────────────────────────────────────
Crossover Fires when the RSI oscillator crosses out of the
oversold band (buy) or overbought band (sell).
CompoundState Two-stage sequence required before a signal fires.
For a buy: RSI must first enter overbought, then
fall into oversold, then cross upward. This filters
out many random crossover signals in choppy markets.
Confluence signals (cyan) fire when a signal occurs at the outer
edge of the extreme band -- indicating deeper exhaustion.
─────────────────────────────────────────────────────────────
WHAT YOU SEE
─────────────────────────────────────────────────────────────
Green cloud Oversold zone (low K-Means band)
Orange cloud Neutral zone (mid K-Means band)
Red cloud Overbought zone (high K-Means band)
Zero line Band equilibrium
Colored RSI line Green when in oversold zone, red when overbought
Cyan dots Bars where RSI crossed into a new K-Means zone
Triangles Buy (up) and sell (down) signals
Cyan triangle High-confluence signal at outer band edge
Signal dots Colored dots on the zero line showing signal state
─────────────────────────────────────────────────────────────────────
SETTINGS
─────────────────────────────────────────────────────────────────────
RSI Length 14 Fractal energy lookback period
Gamma Type Standard
K-Means Lookback 200 Bars used for cluster computation
SD Multiplier 1.0 Scales all band widths (>1 wider, <1 tighter)
Signal Mode Crossover
Smoothing Adaptive Cutoff (recommended)
Cutoff Length 10
Dark Background On
─────────────────────────────────────────────────────────────
IMPORTANT NOTES
─────────────────────────────────────────────────────────────
-- This indicator has not been backtested or forward tested
-- No performance claims are made
-- Shared as a research tool for community review
-- Results will vary by instrument, timeframe, and market conditions
-- This is not financial advice
-- Trading involves substantial risk of loss
-- Past results do not guarantee future performance
-- Use for educational and research purposes only
─────────────────────────────────────────────────────────────
A Laguerre RSI oscillator with three adaptive K-Means bands that
dynamically discover overbought and oversold zones from the RSI
values themselves -- replacing fixed static levels with data-driven
boundaries that adjust to the current instrument and regime.
The oscillator is re-centered around zero. Zero equals the K-Means
band equilibrium. Positive values mean RSI is above the band center.
Negative values mean RSI is below it. This makes the indicator
immediately readable regardless of what the raw RSI value is doing.
─────────────────────────────────────────────────────────────
HOW IT WORKS
─────────────────────────────────────────────────────────────
STEP 1 -- LAGUERRE RSI
The RSI is computed using the Laguerre filter, a four-pole recursive
smoother introduced by John Ehlers in Cybernetic Analysis for Stocks
and Futures. Unlike standard RSI which uses a fixed lookback average,
the Laguerre filter weights recent data through a damping coefficient
called gamma. The result is a smoother, lower-lag oscillator that
stays in overbought or oversold territory longer during genuine trends
and turns faster at reversals.
STEP 2 -- GAMMA CALCULATION (7 methods)
Gamma controls the filter sensitivity. Instead of setting it manually,
this indicator derives it from the market structure itself using one
of seven methods selectable by the user:
Standard Log ratio of cumulative true range to total price
range over the RSI length period. Classic fractal
energy -- the original Ehlers method.
Lanczos Applies the Lanczos gamma-function approximation
to the standard fractal energy value. Produces a
smoother fractional dimension estimate.
MultifractalQM Averages fractal dimensions computed at three
moment orders: q=1 (mean), q=2 (RMS), q=4
(fourth root). Captures multi-moment scaling
behavior of price movement.
MultifractalScale Computes fractal dimension at three time scales
(n, 2n, n/2) and averages them. Provides a
multi-scale view of self-similarity.
VolatilityGK Standard fractal energy scaled by the
Garman-Klass OHLC volatility estimator. Adjusts
gamma for realized volatility using open, high,
low, and close prices.
VolatilitySD Standard fractal energy scaled by the normalized
standard deviation of true range. Similar to GK
but uses a simpler volatility proxy.
Entropy Shannon entropy of the true range distribution
across 10 bins. High entropy = chaotic/ranging.
Low entropy = structured/trending. Gamma reflects
the informational complexity of price movement.
All gamma values are clamped to [0.1, 0.9] to keep the filter stable.
STEP 3 -- K-MEANS CLUSTERING ON RSI VALUES
Rather than clustering price, this indicator clusters the Laguerre RSI
output values themselves over a rolling lookback window. Three cluster
centroids are initialized at the 25th, 50th, and 75th percentile of
the recent RSI distribution. Each bar, all RSI values in the lookback
window are assigned to their nearest centroid. The intra-cluster
standard deviation is computed for each cluster and smoothed to form
the upper and lower band boundaries.
The result is three adaptive bands:
Low band (green) Natural oversold zone for this instrument
Mid band (orange) Neutral equilibrium zone
High band (red) Natural overbought zone for this instrument
These bands are not fixed at 70/30 or any static level. They reflect
where RSI has actually been oscillating over the lookback period.
STEP 4 -- OSCILLATOR TRANSFORM
RSI is subtracted from the average of the three centroids and scaled
by 100. This re-centers the oscillator around zero regardless of the
absolute RSI level, making the chart immediately readable.
STEP 5 -- SMOOTHING (optional)
Four Ehlers filter options are available to smooth the oscillator line:
Raw Unsmoothed -- fastest, most reactive
SuperSmoother Two-pole Ehlers filter -- smooth with low lag
Gaussian Gaussian-weighted smoother
Zero-Lag EMA EMA with lag compensation
Adaptive Cutoff SuperSmoother with volatility-scaled period
(default) -- adjusts smoothing to current noise
─────────────────────────────────────────────────────────────
SIGNAL MODES
─────────────────────────────────────────────────────────────
Crossover Fires when the RSI oscillator crosses out of the
oversold band (buy) or overbought band (sell).
CompoundState Two-stage sequence required before a signal fires.
For a buy: RSI must first enter overbought, then
fall into oversold, then cross upward. This filters
out many random crossover signals in choppy markets.
Confluence signals (cyan) fire when a signal occurs at the outer
edge of the extreme band -- indicating deeper exhaustion.
─────────────────────────────────────────────────────────────
WHAT YOU SEE
─────────────────────────────────────────────────────────────
Green cloud Oversold zone (low K-Means band)
Orange cloud Neutral zone (mid K-Means band)
Red cloud Overbought zone (high K-Means band)
Zero line Band equilibrium
Colored RSI line Green when in oversold zone, red when overbought
Cyan dots Bars where RSI crossed into a new K-Means zone
Triangles Buy (up) and sell (down) signals
Cyan triangle High-confluence signal at outer band edge
Signal dots Colored dots on the zero line showing signal state
─────────────────────────────────────────────────────────────────────
SETTINGS
─────────────────────────────────────────────────────────────────────
RSI Length 14 Fractal energy lookback period
Gamma Type Standard
K-Means Lookback 200 Bars used for cluster computation
SD Multiplier 1.0 Scales all band widths (>1 wider, <1 tighter)
Signal Mode Crossover
Smoothing Adaptive Cutoff (recommended)
Cutoff Length 10
Dark Background On
─────────────────────────────────────────────────────────────
IMPORTANT NOTES
─────────────────────────────────────────────────────────────
-- This indicator has not been backtested or forward tested
-- No performance claims are made
-- Shared as a research tool for community review
-- Results will vary by instrument, timeframe, and market conditions
-- This is not financial advice
-- Trading involves substantial risk of loss
-- Past results do not guarantee future performance
-- Use for educational and research purposes only
─────────────────────────────────────────────────────────────
Скрипт с открытым кодом
В истинном духе TradingView, создатель этого скрипта сделал его открытым исходным кодом, чтобы трейдеры могли проверить и убедиться в его функциональности. Браво автору! Вы можете использовать его бесплатно, но помните, что перепубликация кода подчиняется нашим Правилам поведения.

Отказ от ответственности
Информация и публикации не предназначены для предоставления и не являются финансовыми, инвестиционными, торговыми или другими видами советов или рекомендаций, предоставленных или одобренных TradingView. Подробнее читайте в Условиях использования.
Скрипт с открытым кодом
В истинном духе TradingView, создатель этого скрипта сделал его открытым исходным кодом, чтобы трейдеры могли проверить и убедиться в его функциональности. Браво автору! Вы можете использовать его бесплатно, но помните, что перепубликация кода подчиняется нашим Правилам поведения.
Отказ от ответственности
Информация и публикации не предназначены для предоставления и не являются финансовыми, инвестиционными, торговыми или другими видами советов или рекомендаций, предоставленных или одобренных TradingView. Подробнее читайте в Условиях использования.