OPEN-SOURCE SCRIPT
Volume Buy/Sell Pressure with Hot Percent
FULL DESCRIPTION (Condensed Version)
Volume Buy/Sell Pressure with Hot Percent
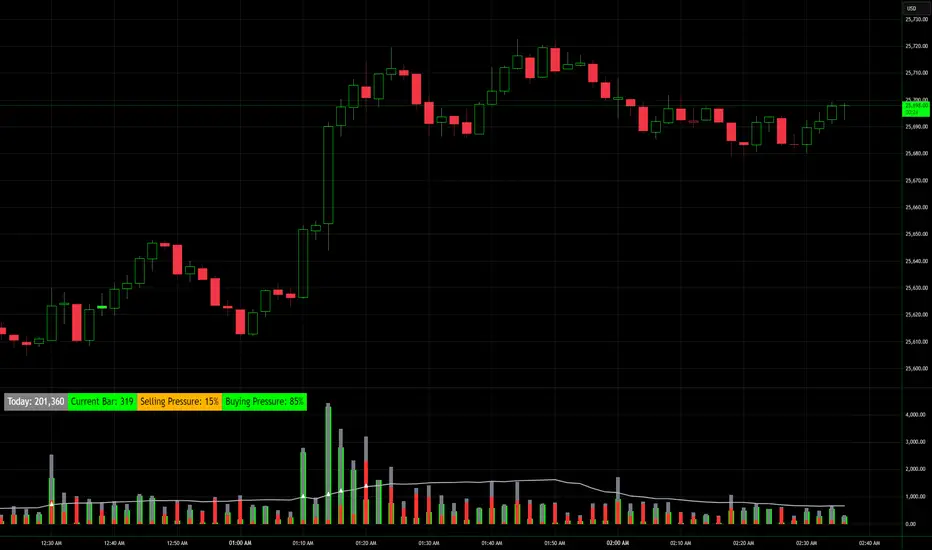
Professional volume analysis indicator revealing real-time buying and selling pressure with hot volume detection and customizable alerts.
Key Features:
Three-Layer Histogram - Visual breakdown: total volume (gray), buying pressure (bright green), selling pressure (bright red)
Flexible Display - Toggle between percentage view or actual volume counts for buying/selling pressure
Real-Time Metrics - Live buying/selling data, current bar volume, daily totals, 30-bar/30-day averages with comma formatting
Hot Volume Detection - Automatic alerts with white triangle markers when volume exceeds threshold
Customizable Labels - 4 sizes (Small/Normal/Large/Huge), 9 positions (all corners/centers/middles), toggle any metric on/off
Smart Color Coding - Green (high volume/buying dominant), Red (selling dominant), Orange (equal pressure), Gray (low volume). Black text on bright backgrounds for maximum contrast.
Alert Conditions:
Hot Volume: Triggers when volume exceeds moving average by specified percentage
Unusual 30-Bar Volume: Current bar significantly above 30-bar average
Unusual 30-Day Volume: Daily volume significantly above 30-day average
Settings:
Display - Toggle metrics, choose percentage/count display, select size and position
Volume - Set unusual volume threshold (default 200%), adjust average length (default 21)
Hot Volume - Choose SMA/EMA, set lookback period (default 20), define threshold (default 100%)
Perfect For:
Day traders scalping futures (MNQ, MES, MYM, MGC, MCL)
Swing traders identifying accumulation/distribution
Breakout traders needing volume confirmation
All timeframes - tick charts to daily/weekly
Use Cases:
Confirm trend strength with pressure alignment
Spot reversals when pressure diverges from price
Validate breakouts with hot volume alerts
Identify smart money through unusual volume
Track institutional activity at key levels
What Makes This Different:
Shows buying vs selling pressure WITHIN each bar using price range methodology. Most indicators only show total volume or simple up/down. This reveals actual pressure distribution regardless of bar direction. Three-layer design makes order flow instantly visible.
Pro Tips:
Use "Large" labels at 100% zoom
Enable volume count display for position sizing
Position labels in corners to avoid price overlap
Enable alerts during pre-market and news events
Watch for divergences: price up + selling pressure up = potential reversal
Compare to both 30-bar and 30-day for full context
Technical:
Pine Script v6
All timeframes and instruments
No repainting
Efficient code, minimal CPU
Three alert conditions
Works on futures, stocks, forex, crypto
Clean, professional presentation. Essential for volume analysis and order flow tracking.
Volume Buy/Sell Pressure with Hot Percent
Professional volume analysis indicator revealing real-time buying and selling pressure with hot volume detection and customizable alerts.
Key Features:
Three-Layer Histogram - Visual breakdown: total volume (gray), buying pressure (bright green), selling pressure (bright red)
Flexible Display - Toggle between percentage view or actual volume counts for buying/selling pressure
Real-Time Metrics - Live buying/selling data, current bar volume, daily totals, 30-bar/30-day averages with comma formatting
Hot Volume Detection - Automatic alerts with white triangle markers when volume exceeds threshold
Customizable Labels - 4 sizes (Small/Normal/Large/Huge), 9 positions (all corners/centers/middles), toggle any metric on/off
Smart Color Coding - Green (high volume/buying dominant), Red (selling dominant), Orange (equal pressure), Gray (low volume). Black text on bright backgrounds for maximum contrast.
Alert Conditions:
Hot Volume: Triggers when volume exceeds moving average by specified percentage
Unusual 30-Bar Volume: Current bar significantly above 30-bar average
Unusual 30-Day Volume: Daily volume significantly above 30-day average
Settings:
Display - Toggle metrics, choose percentage/count display, select size and position
Volume - Set unusual volume threshold (default 200%), adjust average length (default 21)
Hot Volume - Choose SMA/EMA, set lookback period (default 20), define threshold (default 100%)
Perfect For:
Day traders scalping futures (MNQ, MES, MYM, MGC, MCL)
Swing traders identifying accumulation/distribution
Breakout traders needing volume confirmation
All timeframes - tick charts to daily/weekly
Use Cases:
Confirm trend strength with pressure alignment
Spot reversals when pressure diverges from price
Validate breakouts with hot volume alerts
Identify smart money through unusual volume
Track institutional activity at key levels
What Makes This Different:
Shows buying vs selling pressure WITHIN each bar using price range methodology. Most indicators only show total volume or simple up/down. This reveals actual pressure distribution regardless of bar direction. Three-layer design makes order flow instantly visible.
Pro Tips:
Use "Large" labels at 100% zoom
Enable volume count display for position sizing
Position labels in corners to avoid price overlap
Enable alerts during pre-market and news events
Watch for divergences: price up + selling pressure up = potential reversal
Compare to both 30-bar and 30-day for full context
Technical:
Pine Script v6
All timeframes and instruments
No repainting
Efficient code, minimal CPU
Three alert conditions
Works on futures, stocks, forex, crypto
Clean, professional presentation. Essential for volume analysis and order flow tracking.
Скрипт с открытым кодом
В истинном духе TradingView, создатель этого скрипта сделал его открытым исходным кодом, чтобы трейдеры могли проверить и убедиться в его функциональности. Браво автору! Вы можете использовать его бесплатно, но помните, что перепубликация кода подчиняется нашим Правилам поведения.

NPR21 Premium Indicators | Access all tiers at whop.com/npr21 | DM me on TradingView for questions
Отказ от ответственности
Информация и публикации не предназначены для предоставления и не являются финансовыми, инвестиционными, торговыми или другими видами советов или рекомендаций, предоставленных или одобренных TradingView. Подробнее читайте в Условиях использования.
Скрипт с открытым кодом
В истинном духе TradingView, создатель этого скрипта сделал его открытым исходным кодом, чтобы трейдеры могли проверить и убедиться в его функциональности. Браво автору! Вы можете использовать его бесплатно, но помните, что перепубликация кода подчиняется нашим Правилам поведения.
NPR21 Premium Indicators | Access all tiers at whop.com/npr21 | DM me on TradingView for questions
Отказ от ответственности
Информация и публикации не предназначены для предоставления и не являются финансовыми, инвестиционными, торговыми или другими видами советов или рекомендаций, предоставленных или одобренных TradingView. Подробнее читайте в Условиях использования.