Equalhigh Fair Value & Upside
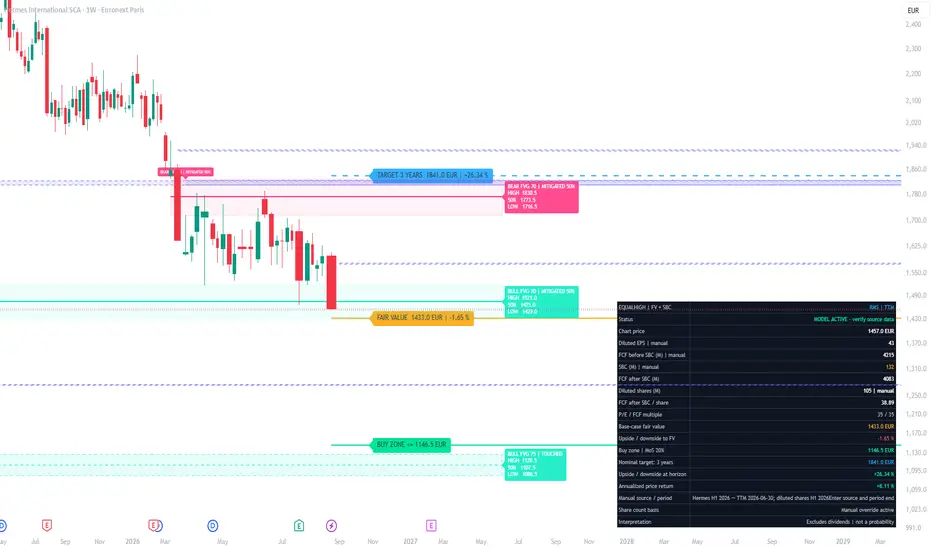
Equalhigh — Fair Value & Upside | SBC v1.1
Equalhigh Fair Value & Upside is a fundamentals-based valuation indicator for stocks. It combines financial data available through TradingView with user-defined valuation assumptions to display fair value, a margin-of-safety buy zone, and an optional future price target.
The FCF component explicitly deducts stock-based compensation (SBC).
This is a valuation tool. It does not predict market turning points or calculate the probability of a price increase.
WHAT THE INDICATOR DISPLAYS
• Orange — Base-case fair value.
• Green — Buy-zone threshold after applying your margin of safety.
• Blue dashed line — Optional nominal target at your selected horizon.
Labels display price levels and potential upside or downside. The dashboard shows the underlying financial inputs, valuation multiples, calculation status, and projected annualized price return.
The green level marks the maximum price within the model’s buy zone. It is not an automatic entry signal.
VALUATION MODELS
Choose between three methods:
• EPS: diluted earnings per share × target P/E.
• FCF after SBC: FCF after deducting SBC, divided by diluted shares, multiplied by the target FCF multiple.
• Hybrid: a weighted combination of both methods.
In Hybrid mode, an EPS weight of 50% gives equal weight to the two components. A weight of 100% uses only EPS; 0% uses only FCF.
Core calculations:
FCF after SBC = FCF before SBC − SBC
FCF after SBC per share = FCF after SBC ÷ diluted shares
Hybrid fair value = EPS weight × EPS valuation + remaining weight × FCF valuation
Buy-zone threshold = fair value × (1 − margin of safety)
Upside/downside (%) = (fair value ÷ chart price − 1) × 100
A negative percentage means the chart price exceeds the model’s fair value.
QUICK START
1. Open the stock’s chart and add the indicator.
2. Select FY or TTM as the financial period.
3. Select the valuation model and, if applicable, the EPS weight.
4. Enter your target P/E and target FCF multiple.
5. Enter SBC for the same period as the FCF and confirm that the amount and period have been checked.
6. Review the retrieved financial data and apply manual overrides where necessary.
7. Optionally enable the projection and enter growth assumptions.
Target multiples default to zero. The relevant valuation component remains suspended until a positive multiple is entered.
DATA AND FINANCIAL PERIODS
The indicator requests diluted EPS, free cash flow, and diluted shares through TradingView’s financial data service. Availability depends on the stock and reporting frequency.
• FY: latest available fiscal-year data.
• TTM: trailing-twelve-month EPS and FCF data.
Selecting TTM does not automatically reconstruct missing financial data from individual reports. If a required field is unavailable, use a verified manual override.
Financial data updates independently of the chart timeframe. Switching from a daily to a weekly chart does not turn annual fundamentals into weekly fundamentals.
STOCK-BASED COMPENSATION
SBC must be entered manually in this version.
Enter the amount in millions of the chart currency. For example, 132 means 132 million.
Use the same reporting period for FCF and SBC. Do not combine annual FCF with six-month SBC.
The confirmation checkbox is required even when SBC is zero. Missing SBC is never silently treated as zero.
The FCF input should be before the SBC deduction applied by this script. Entering an already SBC-adjusted FCF and then entering SBC again would deduct the expense twice.
The EPS component uses the supplied diluted EPS without an additional SBC deduction.
SHARE DATA: FQ, FH AND FY
In TTM mode, select the share-data frequency:
• Auto: uses a positive FQ value first, otherwise FH, otherwise FY.
• FQ: quarterly share data.
• FH: semiannual share data.
• FY: annual share data.
Auto follows an availability order; it does not compare publication dates to identify the newest report.
In FY mode, automatic share retrieval uses FY data regardless of the TTM frequency setting.
The dashboard identifies the selected frequency. Combining TTM cash flows with a quarterly or semiannual average share count is an approximation.
A manual share-count override takes priority over automatic retrieval.
MANUAL OVERRIDES
You can replace:
• Diluted EPS — enter a per-share amount in the chart currency.
• FCF before SBC — enter a total amount in millions of the chart currency.
• Diluted shares — enter the number of shares in millions.
For example, 105.002977 represents 105,002,977 shares.
Record the source and period end in the source field. Manual values remain fixed until you change them and should be reviewed whenever you switch stocks.
Check whether your FCF source deducts lease repayments. The script does not automatically harmonize different FCF definitions.
FUTURE PROJECTION
Enable “Enable projection assumptions” to display the blue target.
Enter:
• Horizon in years.
• Annual diluted EPS growth.
• Annual FCF after SBC per share growth.
Each active valuation component grows at its own rate. Target multiples and Hybrid weights remain constant.
Projected component = current component × (1 + annual growth rate)^years
Annualized price return = [(future target ÷ chart price)^(1 ÷ years) − 1] × 100
Growth rates are entered as percentages: enter 8 for 8%.
FCF growth must already be expressed per share and after SBC. The script does not apply an additional dilution adjustment.
The blue line is a reference level for a future nominal target. It is not a forecast price path or a discounted present value.
Growth inputs are your assumptions. They are not automatically retrieved company guidance or analyst consensus.
WHY “SUSPENDED” MAY APPEAR
The dashboard explains what prevents calculation. Possible causes include:
• Missing or non-positive EPS.
• Missing FCF.
• Missing or non-positive share count.
• Unverified SBC.
• Non-positive FCF after SBC.
• An unconfigured target multiple.
Only components required by the selected model and weight must be valid. In Hybrid mode, the script does not silently redistribute weight when a required component is unavailable.
If shares are unavailable in Auto or FQ mode, try FH for a semiannual reporter, or enter a verified diluted share count manually.
DISPLAY SETTINGS
The dashboard can be positioned in any chart corner.
“Label offset (bars)” moves the labels horizontally relative to the latest bar. Labels are not pinned to the price axis.
Valuation lines begin at the latest bar and extend to the right. The indicator deliberately avoids applying today’s manual inputs retrospectively across the chart.
IMPORTANT LIMITATIONS
• Fair value depends on the selected multiples, weights, growth rates, and financial definitions.
• The indicator does not automatically normalize exceptional items or independently audit company filings.
• It does not separately add net cash or subtract net debt.
• The model may be unsuitable for banks, loss-making businesses, or companies requiring specialized valuation methods.
• Financial-data revisions and manual overrides make this version unsuitable as a historical point-in-time valuation backtest.
• Projected returns exclude dividends, fees, taxes, and currency changes.
• A stock can remain above or below modeled fair value for an extended period.
Use the indicator to make valuation assumptions visible and comparable. Combine its output with company research, financial-statement review, and your own risk-management process.
Equalhigh Fair Value & Upside is a fundamentals-based valuation indicator for stocks. It combines financial data available through TradingView with user-defined valuation assumptions to display fair value, a margin-of-safety buy zone, and an optional future price target.
The FCF component explicitly deducts stock-based compensation (SBC).
This is a valuation tool. It does not predict market turning points or calculate the probability of a price increase.
WHAT THE INDICATOR DISPLAYS
• Orange — Base-case fair value.
• Green — Buy-zone threshold after applying your margin of safety.
• Blue dashed line — Optional nominal target at your selected horizon.
Labels display price levels and potential upside or downside. The dashboard shows the underlying financial inputs, valuation multiples, calculation status, and projected annualized price return.
The green level marks the maximum price within the model’s buy zone. It is not an automatic entry signal.
VALUATION MODELS
Choose between three methods:
• EPS: diluted earnings per share × target P/E.
• FCF after SBC: FCF after deducting SBC, divided by diluted shares, multiplied by the target FCF multiple.
• Hybrid: a weighted combination of both methods.
In Hybrid mode, an EPS weight of 50% gives equal weight to the two components. A weight of 100% uses only EPS; 0% uses only FCF.
Core calculations:
FCF after SBC = FCF before SBC − SBC
FCF after SBC per share = FCF after SBC ÷ diluted shares
Hybrid fair value = EPS weight × EPS valuation + remaining weight × FCF valuation
Buy-zone threshold = fair value × (1 − margin of safety)
Upside/downside (%) = (fair value ÷ chart price − 1) × 100
A negative percentage means the chart price exceeds the model’s fair value.
QUICK START
1. Open the stock’s chart and add the indicator.
2. Select FY or TTM as the financial period.
3. Select the valuation model and, if applicable, the EPS weight.
4. Enter your target P/E and target FCF multiple.
5. Enter SBC for the same period as the FCF and confirm that the amount and period have been checked.
6. Review the retrieved financial data and apply manual overrides where necessary.
7. Optionally enable the projection and enter growth assumptions.
Target multiples default to zero. The relevant valuation component remains suspended until a positive multiple is entered.
DATA AND FINANCIAL PERIODS
The indicator requests diluted EPS, free cash flow, and diluted shares through TradingView’s financial data service. Availability depends on the stock and reporting frequency.
• FY: latest available fiscal-year data.
• TTM: trailing-twelve-month EPS and FCF data.
Selecting TTM does not automatically reconstruct missing financial data from individual reports. If a required field is unavailable, use a verified manual override.
Financial data updates independently of the chart timeframe. Switching from a daily to a weekly chart does not turn annual fundamentals into weekly fundamentals.
STOCK-BASED COMPENSATION
SBC must be entered manually in this version.
Enter the amount in millions of the chart currency. For example, 132 means 132 million.
Use the same reporting period for FCF and SBC. Do not combine annual FCF with six-month SBC.
The confirmation checkbox is required even when SBC is zero. Missing SBC is never silently treated as zero.
The FCF input should be before the SBC deduction applied by this script. Entering an already SBC-adjusted FCF and then entering SBC again would deduct the expense twice.
The EPS component uses the supplied diluted EPS without an additional SBC deduction.
SHARE DATA: FQ, FH AND FY
In TTM mode, select the share-data frequency:
• Auto: uses a positive FQ value first, otherwise FH, otherwise FY.
• FQ: quarterly share data.
• FH: semiannual share data.
• FY: annual share data.
Auto follows an availability order; it does not compare publication dates to identify the newest report.
In FY mode, automatic share retrieval uses FY data regardless of the TTM frequency setting.
The dashboard identifies the selected frequency. Combining TTM cash flows with a quarterly or semiannual average share count is an approximation.
A manual share-count override takes priority over automatic retrieval.
MANUAL OVERRIDES
You can replace:
• Diluted EPS — enter a per-share amount in the chart currency.
• FCF before SBC — enter a total amount in millions of the chart currency.
• Diluted shares — enter the number of shares in millions.
For example, 105.002977 represents 105,002,977 shares.
Record the source and period end in the source field. Manual values remain fixed until you change them and should be reviewed whenever you switch stocks.
Check whether your FCF source deducts lease repayments. The script does not automatically harmonize different FCF definitions.
FUTURE PROJECTION
Enable “Enable projection assumptions” to display the blue target.
Enter:
• Horizon in years.
• Annual diluted EPS growth.
• Annual FCF after SBC per share growth.
Each active valuation component grows at its own rate. Target multiples and Hybrid weights remain constant.
Projected component = current component × (1 + annual growth rate)^years
Annualized price return = [(future target ÷ chart price)^(1 ÷ years) − 1] × 100
Growth rates are entered as percentages: enter 8 for 8%.
FCF growth must already be expressed per share and after SBC. The script does not apply an additional dilution adjustment.
The blue line is a reference level for a future nominal target. It is not a forecast price path or a discounted present value.
Growth inputs are your assumptions. They are not automatically retrieved company guidance or analyst consensus.
WHY “SUSPENDED” MAY APPEAR
The dashboard explains what prevents calculation. Possible causes include:
• Missing or non-positive EPS.
• Missing FCF.
• Missing or non-positive share count.
• Unverified SBC.
• Non-positive FCF after SBC.
• An unconfigured target multiple.
Only components required by the selected model and weight must be valid. In Hybrid mode, the script does not silently redistribute weight when a required component is unavailable.
If shares are unavailable in Auto or FQ mode, try FH for a semiannual reporter, or enter a verified diluted share count manually.
DISPLAY SETTINGS
The dashboard can be positioned in any chart corner.
“Label offset (bars)” moves the labels horizontally relative to the latest bar. Labels are not pinned to the price axis.
Valuation lines begin at the latest bar and extend to the right. The indicator deliberately avoids applying today’s manual inputs retrospectively across the chart.
IMPORTANT LIMITATIONS
• Fair value depends on the selected multiples, weights, growth rates, and financial definitions.
• The indicator does not automatically normalize exceptional items or independently audit company filings.
• It does not separately add net cash or subtract net debt.
• The model may be unsuitable for banks, loss-making businesses, or companies requiring specialized valuation methods.
• Financial-data revisions and manual overrides make this version unsuitable as a historical point-in-time valuation backtest.
• Projected returns exclude dividends, fees, taxes, and currency changes.
• A stock can remain above or below modeled fair value for an extended period.
Use the indicator to make valuation assumptions visible and comparable. Combine its output with company research, financial-statement review, and your own risk-management process.

Отказ от ответственности
Информация и публикации не предназначены для предоставления и не являются финансовыми, инвестиционными, торговыми или другими видами советов или рекомендаций, предоставленных или одобренных TradingView. Подробнее читайте в Условиях использования.
Отказ от ответственности
Информация и публикации не предназначены для предоставления и не являются финансовыми, инвестиционными, торговыми или другими видами советов или рекомендаций, предоставленных или одобренных TradingView. Подробнее читайте в Условиях использования.