OPEN-SOURCE SCRIPT
Analogue Matcher | GainzAlgo
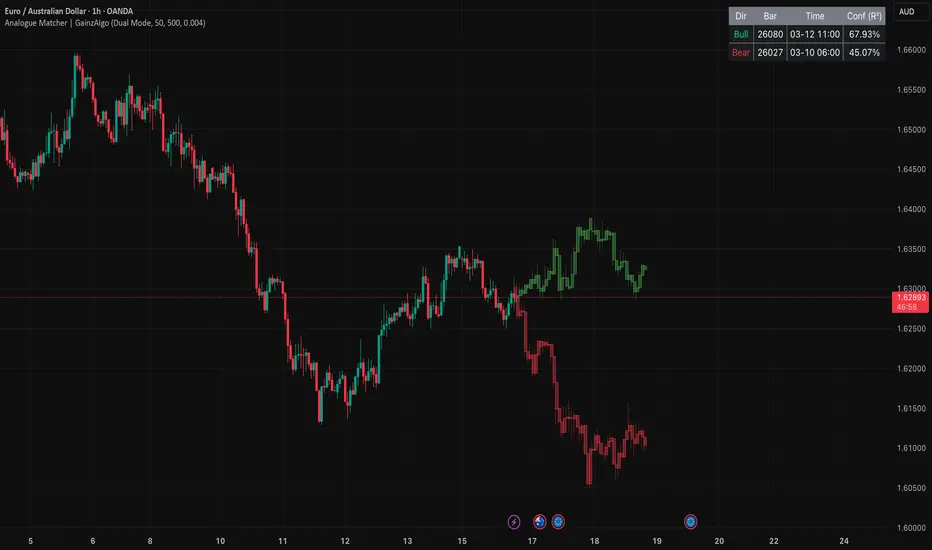
Analogue Matcher: Dual-Path Regression Projection [R²]
- What It Is
The Analogue Matcher is a high-performance pattern recognition engine designed to find historical "price twins." Unlike standard fractals that look for raw shape similarity, this tool utilizes Linear Regression Analysis to identify periods in the past where market velocity (slope) and trend consistency ($R^2$) were near-identical to current conditions. It then projects those historical outcomes forward as "Ghost Candles," providing a probabilistic roadmap of where price might go. - How It Works
The indicator operates by scanning a user defined amount of lookback bars of history in real-time (Default 500).
• The Scan: It calculates the current regression slope over a user-defined window.
• The Match: It iterates through the lookback period to find the closest matches based on a strict Slope Tolerance.
• Dual-Path Intelligence: In "Dual Mode," the script identifies the single best Bullish outcome and the single best Bearish outcome simultaneously. This prevents "bias-blindness" by showing you the best-case scenarios for both directions. - Understanding Confidence & R2
The "Conf (R²)" column in your dashboard is the heart of the script's decision-making.
• Slope Similarity: Measures how closely the historical angle matches the current angle.
• R2 (Coefficient of Determination): Measures the "cleanliness" of the trend. An R2 of 100.0 is a perfect straight line; 0.0 is pure noise.
• The Percentage: Our algorithm combines these two factors. A 90%+ Confidence rating means you have found a historical twin that moved at the same speed and with the same level of trend maturity as the current bar. - How to Use: A Risk Management Approach
This is not a "magic signal" generator—it is a Risk Management and Bias Tool.
• Identify Convergence: If both the Bullish and Bearish paths show high confidence (>80%) and both point in the same direction, you have high-probability confluence.
• Divergence Warning: If the Bullish path has 95% confidence but the Bearish path has only 10%, the historical precedent for a trend reversal is mathematically weak. Your bias in this case would lean bullish. Inverse if it’s flipped with a high bearish confidence and a low bullish confidence.
• Filtering Noise: Use the R2 percentage to ignore "messy" matches. If the confidence is below 50%, the analogue is likely too "noisy" to be used for a high-conviction trade entry.
• Single Mode for Speed: Switch to Single Mode on lower timeframes (1m, 5m) to find the absolute "Best Fit" twin for quick scalping targets. - Master the Engine: Key Inputs
To get the most out of the Analogue Matcher, it’s essential to understand the "knobs" you are turning. Tuning these correctly is the difference between finding a perfect twin and seeing random noise.
• Mode Selection (Single vs. Dual): Single Mode: Focuses the processing power on finding the absolute "Best Fit" regardless of direction. Ideal for high-speed scalping or very large lookbacks. Dual Mode: The full "Risk Management" suite. It forces the script to find both a Bullish and a Bearish path to show you the two most likely outcomes.
• Projection Window: This determines the size of the "Ghost." If set to 50, the script analyzes a 50-bar trend and projects a 50-bar future.
• Lookback Period: This is how far into the past the engine scans. While the script is optimized for performance, keeping this within a reasonable range (500–2000) ensures fast UI response.
• Slope Tolerance: This is your "Sensitivity" setting. Lower Values (0.001 - 0.004): Very strict. The script will only show matches that have a nearly identical angle of attack. Higher Values (>0.01): More lenient. Use this in highly volatile markets (like Crypto) where trends are aggressive and vary in steepness. - Examples
In this image, we can see BTCUSD on the daily. The confidence favours a bullish move, both Bearish and Bullish possible paths are plotted. Let’s see what happens.
The outcome was an initial bullish move though with a bit of a neutral tilt, as it ended relatively flat.
Now let us look at ES1!:
In this case, the indicator is showing 2 possible paths (Dual Mode), with a bullish tilt. Let’s see what happened next:
The move was indeed bullish, and volatility remained intact through the move. - Important Considerations
The indicators true strength stems from its ability to act as a risk management tool and compare the degree of “fit” of each respective path (i.e. bullish vs. bearish). If you are looking to take a bearish position on a ticker, but you see that the R2 skew slightly favours a move to the upside, you may want to hold off on pulling the short trigger until you have a skew that fits your bias.
While the paths are likely not going to be a perfect, identical match, the power comes from understanding the confidence skew of the bullish vs bearish path. This is your saving grace for managing risk in your positions.
Though the matches are not likely to be perfect, they are scaled to the ticker’s ATR and thus can be used to help you gauge potential entries, exits and positioning areas.
For example, if we look at SPY on the hourly timeframe:
We see we have a bearish skew. The bearish path has sizeable upside. We can use this forecasted range to identify potential entry/resistance areas like so:
Now let’s see how it plays out:
You can see that the key forecast areas provided actual levels for support and resistance! - Concluding Remarks
In a market driven by algorithmic repetition, the Analogue Matcher gives you the power to see the "scripts" the market has run before. By quantifying the similarity of price action through regression, traders can move away from "gut feelings" and toward data-driven forecasts.
Скрипт с открытым кодом
В истинном духе TradingView, создатель этого скрипта сделал его открытым исходным кодом, чтобы трейдеры могли проверить и убедиться в его функциональности. Браво автору! Вы можете использовать его бесплатно, но помните, что перепубликация кода подчиняется нашим Правилам поведения.

Get GainzAlgo only at gainzalgo.com
Отказ от ответственности
Информация и публикации не предназначены для предоставления и не являются финансовыми, инвестиционными, торговыми или другими видами советов или рекомендаций, предоставленных или одобренных TradingView. Подробнее читайте в Условиях использования.
Скрипт с открытым кодом
В истинном духе TradingView, создатель этого скрипта сделал его открытым исходным кодом, чтобы трейдеры могли проверить и убедиться в его функциональности. Браво автору! Вы можете использовать его бесплатно, но помните, что перепубликация кода подчиняется нашим Правилам поведения.
Get GainzAlgo only at gainzalgo.com
Отказ от ответственности
Информация и публикации не предназначены для предоставления и не являются финансовыми, инвестиционными, торговыми или другими видами советов или рекомендаций, предоставленных или одобренных TradingView. Подробнее читайте в Условиях использования.