Gold-Silver Ratio Monitor - Light
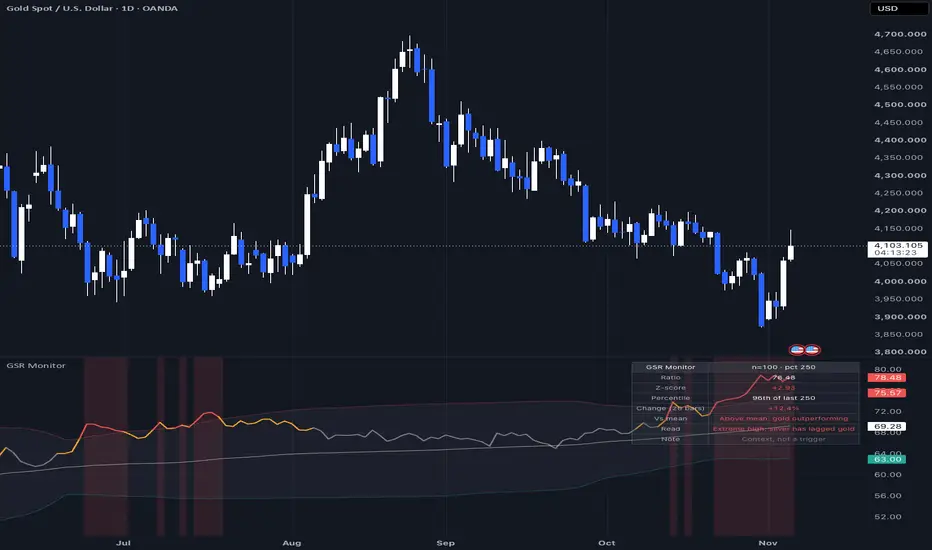
The gold-silver ratio — how many ounces of silver one ounce of gold buys — read against its own recent history: a rolling mean, z-score bands, a one-year percentile and a compact dashboard that says in plain words whether silver is lagging or outrunning gold.
WHAT IT DOES
• Computes the ratio from two symbols of your choice (default: gold spot / silver spot), on the chart timeframe or on a fixed one (daily is the classic reading).
• Plots the ratio, its rolling mean and ± z-score bands; the line changes colour as the ratio moves from normal to stretched to extreme, and the background is tinted at extremes.
• Dashboard (top right): ratio, z-score, percentile over the last N bars, change over the last 20 bars, position versus the mean, and a one-line read ("Extreme high: silver has lagged gold", "Normal range", …).
• Six alerts, all on transitions: z-score crossing above/below the extreme threshold, coming back inside, and the ratio crossing its mean in either direction.
HOW TO READ IT
A high ratio means silver is cheap relative to gold; a low ratio means silver has outrun gold. The z-score tells you how unusual the current level is versus the window you chose, and the percentile tells you where it sits over roughly a year. These are descriptions of the present. A stretched ratio can stay stretched for months; the tool does not say when, or whether, it will revert.
HOW TO USE
1. Add to any chart. The default symbols are OANDA:XAUUSD and OANDA:XAGUSD; change them if you trade futures or CFDs, or tick "Use current chart as gold".
2. Pick the timeframe. Daily with a 100-bar mean and a 250-bar percentile is a sensible default; intraday readings are noisier.
3. Use the read line as context for your gold or silver trade, not as a trigger. If you want notifications, enable the alerts.
SETTINGS
Gold symbol · Silver symbol · Use current chart as gold · Timeframe · Mean / z-score length (100) · Percentile length (250) · Change lookback (20) · Stretched threshold (1.0) · Extreme threshold (2.0) · mean, bands, background tint, dashboard position and size.
NOTES
Both series are requested without lookahead; nothing repaints. Division is guarded (no value when silver data is missing or zero). Pine Script v6, compiles with zero warnings. Open-source so you can audit every line.
No indicator is infallible. Nothing here is financial advice — every trading decision is your own.
WHAT IT DOES
• Computes the ratio from two symbols of your choice (default: gold spot / silver spot), on the chart timeframe or on a fixed one (daily is the classic reading).
• Plots the ratio, its rolling mean and ± z-score bands; the line changes colour as the ratio moves from normal to stretched to extreme, and the background is tinted at extremes.
• Dashboard (top right): ratio, z-score, percentile over the last N bars, change over the last 20 bars, position versus the mean, and a one-line read ("Extreme high: silver has lagged gold", "Normal range", …).
• Six alerts, all on transitions: z-score crossing above/below the extreme threshold, coming back inside, and the ratio crossing its mean in either direction.
HOW TO READ IT
A high ratio means silver is cheap relative to gold; a low ratio means silver has outrun gold. The z-score tells you how unusual the current level is versus the window you chose, and the percentile tells you where it sits over roughly a year. These are descriptions of the present. A stretched ratio can stay stretched for months; the tool does not say when, or whether, it will revert.
HOW TO USE
1. Add to any chart. The default symbols are OANDA:XAUUSD and OANDA:XAGUSD; change them if you trade futures or CFDs, or tick "Use current chart as gold".
2. Pick the timeframe. Daily with a 100-bar mean and a 250-bar percentile is a sensible default; intraday readings are noisier.
3. Use the read line as context for your gold or silver trade, not as a trigger. If you want notifications, enable the alerts.
SETTINGS
Gold symbol · Silver symbol · Use current chart as gold · Timeframe · Mean / z-score length (100) · Percentile length (250) · Change lookback (20) · Stretched threshold (1.0) · Extreme threshold (2.0) · mean, bands, background tint, dashboard position and size.
NOTES
Both series are requested without lookahead; nothing repaints. Division is guarded (no value when silver data is missing or zero). Pine Script v6, compiles with zero warnings. Open-source so you can audit every line.
No indicator is infallible. Nothing here is financial advice — every trading decision is your own.

Measured, not assumed. Full studies with sample sizes and confidence intervals: deltaterminal.io/research
Отказ от ответственности
Информация и публикации не предназначены для предоставления и не являются финансовыми, инвестиционными, торговыми или другими видами советов или рекомендаций, предоставленных или одобренных TradingView. Подробнее читайте в Условиях использования.
Measured, not assumed. Full studies with sample sizes and confidence intervals: deltaterminal.io/research
Отказ от ответственности
Информация и публикации не предназначены для предоставления и не являются финансовыми, инвестиционными, торговыми или другими видами советов или рекомендаций, предоставленных или одобренных TradingView. Подробнее читайте в Условиях использования.