OPEN-SOURCE SCRIPT
Hurst Cycles
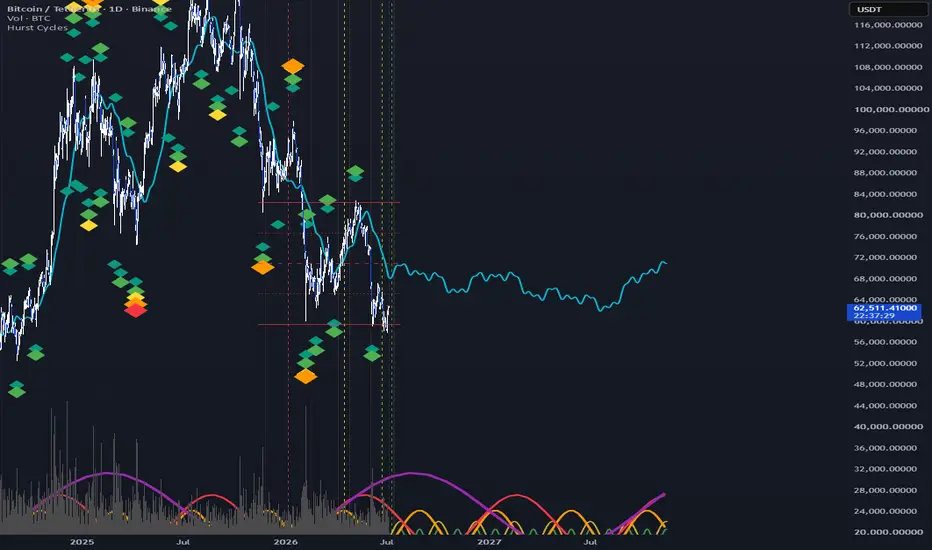
What it is. An implementation of J.M. Hurst's nominal cyclic model. Hurst's premise: price movement is partly the sum of several nested cycles of roughly fixed wavelength (20-day, 40-day, 80-day, 20-week, 40-week, 18-month, 54-month...), harmonically related — each roughly half the length of the next — plus an underlying trend and noise. The indicator detects each cycle's troughs from price pivots, marks troughs and peaks with stacked diamonds (peaks defined properly, as the highest high between consecutive troughs), draws each cycle as a sine wave phased to its last trough, sums the enabled cycles into a composite model line that rides the candles, projects expected future trough dates as vertical lines with a tolerance window, and offers FLDs (price displaced forward half a wavelength — crossings generate Hurst's classic targets). Wavelengths are defined in calendar days on the daily timeframe and auto-rescale so the same cycle structure appears on any chart timeframe.
How to use it properly. The workflow that matches how Hurst actually worked: start on the daily chart with everything at defaults and check whether the diamonds are landing near obvious lows — if the instrument's real cycles run consistently longer or shorter than nominal, adjust the wavelength inputs until troughs line up (Hurst expected the nominal values to be starting points, not universal constants). Then trade the synchrony: the meaningful moments are when several cycles trough together — the composite dipping while multiple vertical windows cluster in the same zone is the signal Hurst's whole method builds toward, and one cycle's window alone is weak evidence. Use the manual anchors as your judgment layer: pivot confirmation takes half a wavelength, so when you believe a major low just printed, enter its date and price and the model re-phases immediately — that's how you keep the projection current instead of half a cycle stale. And treat the tolerance windows as zones to watch for a turn with confirmation from price, never as dates to blindly buy.
Downfalls — read these before trusting it with money. The structural ones first: cycle troughs confirm half a wavelength after they occur, so every automatic phasing is backward-looking by design — the 18-month cycle's trough isn't machine-confirmed until ~9 months later (manual anchors are the workaround, but then the phasing is your opinion). Second, the tolerance window is a heuristic, not Hurst's statistics — real Hurst analysis derives timing variance from the instrument itself, and this ±% is a stand-in you should tune. Third, the model is phase-only: amplitude weighting is a wavelength-based approximation, and the composite says nothing about how far price moves, only roughly when it might turn. Fourth, pivot detection is mechanical — it will happily phase a cycle off a news-spike low that a human analyst would skip, and in strong trends the shorter cycles' troughs get dragged late (Hurst's own observation). Practical ones: future projections extrapolate calendar time from recent bar spacing, so on stock charts distant dates drift slightly since future weekends aren't skipped; the biggest cycles can't pivot-confirm on intraday charts (Pine's 5000-bar lookback limit) and rely on manual anchors there; history only draws as far back as bars loaded on your chart; and each new confirmed trough re-phases everything, so projections legitimately move over time — that's the method working, not the indicator glitching.
The honest framing. Cycle analysis is a minority view of how markets work — the academic mainstream is skeptical that fixed-period cycles persist, and even practitioners regard Hurst's model as a probabilistic timing framework, not a prediction machine. Its best use is narrowing when to pay attention and stacking confluence with your other analysis; its worst use is treating a vertical line nine months out as an appointment price is obligated to keep. Nothing it draws is financial advice, and the further into the future a projection extends, the more decorative it becomes.
How to use it properly. The workflow that matches how Hurst actually worked: start on the daily chart with everything at defaults and check whether the diamonds are landing near obvious lows — if the instrument's real cycles run consistently longer or shorter than nominal, adjust the wavelength inputs until troughs line up (Hurst expected the nominal values to be starting points, not universal constants). Then trade the synchrony: the meaningful moments are when several cycles trough together — the composite dipping while multiple vertical windows cluster in the same zone is the signal Hurst's whole method builds toward, and one cycle's window alone is weak evidence. Use the manual anchors as your judgment layer: pivot confirmation takes half a wavelength, so when you believe a major low just printed, enter its date and price and the model re-phases immediately — that's how you keep the projection current instead of half a cycle stale. And treat the tolerance windows as zones to watch for a turn with confirmation from price, never as dates to blindly buy.
Downfalls — read these before trusting it with money. The structural ones first: cycle troughs confirm half a wavelength after they occur, so every automatic phasing is backward-looking by design — the 18-month cycle's trough isn't machine-confirmed until ~9 months later (manual anchors are the workaround, but then the phasing is your opinion). Second, the tolerance window is a heuristic, not Hurst's statistics — real Hurst analysis derives timing variance from the instrument itself, and this ±% is a stand-in you should tune. Third, the model is phase-only: amplitude weighting is a wavelength-based approximation, and the composite says nothing about how far price moves, only roughly when it might turn. Fourth, pivot detection is mechanical — it will happily phase a cycle off a news-spike low that a human analyst would skip, and in strong trends the shorter cycles' troughs get dragged late (Hurst's own observation). Practical ones: future projections extrapolate calendar time from recent bar spacing, so on stock charts distant dates drift slightly since future weekends aren't skipped; the biggest cycles can't pivot-confirm on intraday charts (Pine's 5000-bar lookback limit) and rely on manual anchors there; history only draws as far back as bars loaded on your chart; and each new confirmed trough re-phases everything, so projections legitimately move over time — that's the method working, not the indicator glitching.
The honest framing. Cycle analysis is a minority view of how markets work — the academic mainstream is skeptical that fixed-period cycles persist, and even practitioners regard Hurst's model as a probabilistic timing framework, not a prediction machine. Its best use is narrowing when to pay attention and stacking confluence with your other analysis; its worst use is treating a vertical line nine months out as an appointment price is obligated to keep. Nothing it draws is financial advice, and the further into the future a projection extends, the more decorative it becomes.
Скрипт с открытым кодом
В истинном духе TradingView, создатель этого скрипта сделал его открытым исходным кодом, чтобы трейдеры могли проверить и убедиться в его функциональности. Браво автору! Вы можете использовать его бесплатно, но помните, что перепубликация кода подчиняется нашим Правилам поведения.

Отказ от ответственности
Информация и публикации не предназначены для предоставления и не являются финансовыми, инвестиционными, торговыми или другими видами советов или рекомендаций, предоставленных или одобренных TradingView. Подробнее читайте в Условиях использования.
Скрипт с открытым кодом
В истинном духе TradingView, создатель этого скрипта сделал его открытым исходным кодом, чтобы трейдеры могли проверить и убедиться в его функциональности. Браво автору! Вы можете использовать его бесплатно, но помните, что перепубликация кода подчиняется нашим Правилам поведения.
Отказ от ответственности
Информация и публикации не предназначены для предоставления и не являются финансовыми, инвестиционными, торговыми или другими видами советов или рекомендаций, предоставленных или одобренных TradingView. Подробнее читайте в Условиях использования.