OPEN-SOURCE SCRIPT
Обновлено Candle Levels

Candle Levels is a rebuild of my original Candle Levels Pro framework, designed to map important completed-candle and session reference levels directly on the price chart. This script focuses on current day/session levels, previous close, lower-timeframe completed candle levels, daily candle levels, weekly candle levels, and monthly candle levels. It also includes source-aware line starts and compact right-side labels so users can quickly see the level price, current distance from price, and level tag.
────────────────────────────
Core Idea
────────────────────────────
Markets often react around prior candle highs, lows, closes, session opens, and active-session extremes.
Candle Levels turns those reference points into organized horizontal levels:
• Current High of Day / Low of Day
• Regular-session open
• Premarket open
• Current close reference
• Previous close
• Previous completed LTF candle highs/lows/closes
• Previous completed daily candle highs/lows/closes
• Previous completed weekly candle highs/lows/closes
• Previous completed monthly candle highs/lows/closes
Instead of plotting every possible historical line, the script focuses on the active references that matter most to you now.
────────────────────────────
Asset-Aware Source Logic
────────────────────────────
The script separates stock/fund/ADR behavior from crypto behavior. It is not currently set up for futures. Futures have different session structures, settlement behavior, overnight handling, contract-specific calendars, and reference-level needs. A separate futures-focused version will be handled as its own script so the logic can be built specifically around futures sessions instead of forcing futures into the stock/crypto model.
For US-session stocks, funds, and ADRs:
• Close references use regular-session close data
• High/low references use extended/full-session high-low data when available
• HOD / LOD track the current full-session high and low
• PCL uses the prior regular-session daily close
• OPEN uses the regular-session open
• PMO uses the first premarket open
For crypto:
• Levels use the native 24-hour chart stream
• Daily levels follow the native 24-hour daily cycle
• US-session-only references such as PMO and CC are hidden automatically
This source split is intentional. Many traders want regular-session closes but still want premarket and after-hours highs/lows visible when those extremes matter.
────────────────────────────
Current Session Levels
────────────────────────────
The current-session block tracks:
• HOD
• LOD
• OPEN
• PMO
• CCL
• PCL
HOD and LOD update as the active day makes new extremes. Their lines can begin at the candle that created the current high or low, making the source of the level visually clear.
PCL has its own dedicated input group, label padding, and bull/bear color controls so it can be styled separately from the daily high/low rows.
────────────────────────────
Lower-Timeframe Candle Levels
────────────────────────────
The LTF section includes hardcoded completed-candle references for:
• 10m[1]
• 15m[1]
• 30m[1]
• 1h[1]
• 2h[1]
• 4h[1]
• 8h[1]
Each row can show the previous completed candle’s:
• High
• Low
• Close
The “[1]” tag means previous completed candle for that timeframe. For example, 1h[1] means the prior completed one-hour candle, not a rolling last-60-minutes window.
────────────────────────────
Daily Candle Levels
────────────────────────────
The Daily section includes:
• D[1] High / Low
• D[2] High / Low / Close
• D[3] High / Low / Close
D[1] is the most recent completed daily candle. D[2] is the single daily candle two completed sessions back. D[3] is the single daily candle three completed sessions back.
These are candle offsets, not rolling multiday ranges.
For US-session equities, Daily Hi/Lo levels can include premarket or after-hours extremes when full-session history is available. This means a D[n]Hi or D[n]Lo may not always match the visible regular-session-only TradingView daily candle.
Daily Close levels use the regular-session close source for US-session equities.
────────────────────────────
Weekly And Monthly Candle Levels
────────────────────────────
The Weekly section includes:
• W[1] High / Low / Close
• W[2] High / Low / Close
W[1] means the prior completed 1-week candle. W[2] means the single 1-week candle two completed weeks back. W[2] is not a 2-week candle.
The Monthly section includes:
• M[1] High / Low / Close
• M[2] High / Low / Close
• M[3] High / Low / Close
M[1] means the prior completed 1-month candle. M[3] means the single 1-month candle three completed months back. These are not rolling multi-month ranges.
Weekly and Monthly rows have independent high/low label controls, close label controls, and per-row label padding inputs.
────────────────────────────
Line Start Modes
────────────────────────────
Daily, Weekly, and Monthly levels include source-aware line-start controls.
Active Period:
Starts the level from the current active period. This keeps the chart cleaner and avoids long historical spans.
Source Window:
Starts the level from the beginning of the completed source candle window used for that offset.
Source Candle:
Starts high/low lines from the chart candle that created the completed source high or low when that source timing is available. Close lines start from the completed source close candle when available.
If the exact source candle is not available, the script falls back to Source Window when available, then Active Period.
────────────────────────────
Right-Side Labels
────────────────────────────
All labels are right-side text labels only.
Each label can show:
• price row
• dollar difference from current price
• percent difference from current price
• level tag row
Labels use EM-space padding instead of x-offset tricks, which helps keep the labels visually staggered while still pinned to the current bar.
Different level groups have their own padding controls, and the newer Daily / Weekly / Monthly sections include more granular row padding so overlapping labels can be separated cleanly.
────────────────────────────
Important Levels Library
────────────────────────────
This version now uses my shared ImportantLevelsLinesLabels_Utilities library: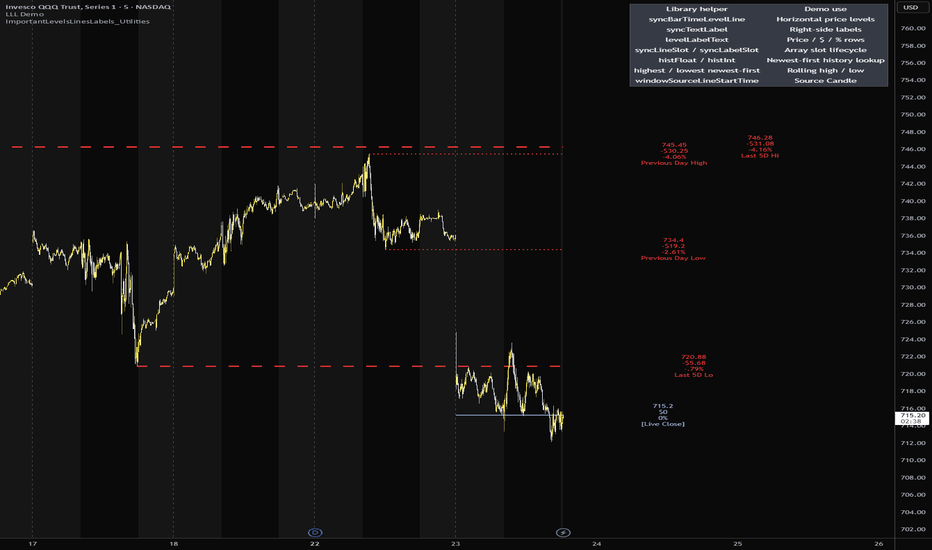
That library handles the reusable output infrastructure:
• right-side label text
• price / dollar / percent formatting
• line style resolution
• label size resolution
• bar-time horizontal level lines
• transparent text labels
• object slot arrays
• history-array pruning
• source-aware line-start routing
The script itself still owns the source engine, session behavior, candle tracking, request.security() logic, and final visibility conditions.
This keeps Candle Levels Pro cleaner internally while making the level-output system more consistent with future scripts.
────────────────────────────
How I Use It
────────────────────────────
I use Candle Levels as a price-map tool.
A few practical reads:
• HOD / LOD show where the active session has expanded.
• OPEN and PMO help frame current price against the regular and premarket starts.
• PCL shows where price is relative to the prior regular-session close.
• LTF levels help identify nearby short-term reference points.
• Daily, Weekly, and Monthly levels help organize higher-timeframe context.
• Source Candle mode helps show where a completed candle high, low, or close actually came from.
• Right-side labels make it easier to compare distance from current price without manually measuring every level.
This is not intended to be a standalone buy/sell signal tool. It is a visual reference framework for organizing important price levels, session context, and completed candle structure.
────────────────────────────
Chart Examples
────────────────────────────


────────────────────────────
Core Idea
────────────────────────────
Markets often react around prior candle highs, lows, closes, session opens, and active-session extremes.
Candle Levels turns those reference points into organized horizontal levels:
• Current High of Day / Low of Day
• Regular-session open
• Premarket open
• Current close reference
• Previous close
• Previous completed LTF candle highs/lows/closes
• Previous completed daily candle highs/lows/closes
• Previous completed weekly candle highs/lows/closes
• Previous completed monthly candle highs/lows/closes
Instead of plotting every possible historical line, the script focuses on the active references that matter most to you now.
────────────────────────────
Asset-Aware Source Logic
────────────────────────────
The script separates stock/fund/ADR behavior from crypto behavior. It is not currently set up for futures. Futures have different session structures, settlement behavior, overnight handling, contract-specific calendars, and reference-level needs. A separate futures-focused version will be handled as its own script so the logic can be built specifically around futures sessions instead of forcing futures into the stock/crypto model.
For US-session stocks, funds, and ADRs:
• Close references use regular-session close data
• High/low references use extended/full-session high-low data when available
• HOD / LOD track the current full-session high and low
• PCL uses the prior regular-session daily close
• OPEN uses the regular-session open
• PMO uses the first premarket open
For crypto:
• Levels use the native 24-hour chart stream
• Daily levels follow the native 24-hour daily cycle
• US-session-only references such as PMO and CC are hidden automatically
This source split is intentional. Many traders want regular-session closes but still want premarket and after-hours highs/lows visible when those extremes matter.
────────────────────────────
Current Session Levels
────────────────────────────
The current-session block tracks:
• HOD
• LOD
• OPEN
• PMO
• CCL
• PCL
HOD and LOD update as the active day makes new extremes. Their lines can begin at the candle that created the current high or low, making the source of the level visually clear.
PCL has its own dedicated input group, label padding, and bull/bear color controls so it can be styled separately from the daily high/low rows.
────────────────────────────
Lower-Timeframe Candle Levels
────────────────────────────
The LTF section includes hardcoded completed-candle references for:
• 10m[1]
• 15m[1]
• 30m[1]
• 1h[1]
• 2h[1]
• 4h[1]
• 8h[1]
Each row can show the previous completed candle’s:
• High
• Low
• Close
The “[1]” tag means previous completed candle for that timeframe. For example, 1h[1] means the prior completed one-hour candle, not a rolling last-60-minutes window.
────────────────────────────
Daily Candle Levels
────────────────────────────
The Daily section includes:
• D[1] High / Low
• D[2] High / Low / Close
• D[3] High / Low / Close
D[1] is the most recent completed daily candle. D[2] is the single daily candle two completed sessions back. D[3] is the single daily candle three completed sessions back.
These are candle offsets, not rolling multiday ranges.
For US-session equities, Daily Hi/Lo levels can include premarket or after-hours extremes when full-session history is available. This means a D[n]Hi or D[n]Lo may not always match the visible regular-session-only TradingView daily candle.
Daily Close levels use the regular-session close source for US-session equities.
────────────────────────────
Weekly And Monthly Candle Levels
────────────────────────────
The Weekly section includes:
• W[1] High / Low / Close
• W[2] High / Low / Close
W[1] means the prior completed 1-week candle. W[2] means the single 1-week candle two completed weeks back. W[2] is not a 2-week candle.
The Monthly section includes:
• M[1] High / Low / Close
• M[2] High / Low / Close
• M[3] High / Low / Close
M[1] means the prior completed 1-month candle. M[3] means the single 1-month candle three completed months back. These are not rolling multi-month ranges.
Weekly and Monthly rows have independent high/low label controls, close label controls, and per-row label padding inputs.
────────────────────────────
Line Start Modes
────────────────────────────
Daily, Weekly, and Monthly levels include source-aware line-start controls.
Active Period:
Starts the level from the current active period. This keeps the chart cleaner and avoids long historical spans.
Source Window:
Starts the level from the beginning of the completed source candle window used for that offset.
Source Candle:
Starts high/low lines from the chart candle that created the completed source high or low when that source timing is available. Close lines start from the completed source close candle when available.
If the exact source candle is not available, the script falls back to Source Window when available, then Active Period.
────────────────────────────
Right-Side Labels
────────────────────────────
All labels are right-side text labels only.
Each label can show:
• price row
• dollar difference from current price
• percent difference from current price
• level tag row
Labels use EM-space padding instead of x-offset tricks, which helps keep the labels visually staggered while still pinned to the current bar.
Different level groups have their own padding controls, and the newer Daily / Weekly / Monthly sections include more granular row padding so overlapping labels can be separated cleanly.
────────────────────────────
Important Levels Library
────────────────────────────
This version now uses my shared ImportantLevelsLinesLabels_Utilities library:
That library handles the reusable output infrastructure:
• right-side label text
• price / dollar / percent formatting
• line style resolution
• label size resolution
• bar-time horizontal level lines
• transparent text labels
• object slot arrays
• history-array pruning
• source-aware line-start routing
The script itself still owns the source engine, session behavior, candle tracking, request.security() logic, and final visibility conditions.
This keeps Candle Levels Pro cleaner internally while making the level-output system more consistent with future scripts.
────────────────────────────
How I Use It
────────────────────────────
I use Candle Levels as a price-map tool.
A few practical reads:
• HOD / LOD show where the active session has expanded.
• OPEN and PMO help frame current price against the regular and premarket starts.
• PCL shows where price is relative to the prior regular-session close.
• LTF levels help identify nearby short-term reference points.
• Daily, Weekly, and Monthly levels help organize higher-timeframe context.
• Source Candle mode helps show where a completed candle high, low, or close actually came from.
• Right-side labels make it easier to compare distance from current price without manually measuring every level.
This is not intended to be a standalone buy/sell signal tool. It is a visual reference framework for organizing important price levels, session context, and completed candle structure.
────────────────────────────
Chart Examples
────────────────────────────
Информация о релизе
OPEN / OPEN[1] Premarket ImprovementsThe regular-session OPEN reference is now session-aware for stocks, funds, and ADRs.
During today's premarket, the prior regular-session open is shown as [OPEN[1]] instead of carrying forward as the current [OPEN]. Its line now begins at the current day’s premarket open rather than extending back to the previous day’s opening candle.
When regular trading begins, the level automatically updates to the current session’s [OPEN] and starts from the new regular trading hours open candle as usual.
New independent controls were also added for:
OPEN[1] Line Plot
OPEN[1] Right-side Label
This allows users to hide the prior-day open during premarket while keeping the normal current-session OPEN enabled.
Информация о релизе
Candle Levels architecture update. Expanded asset support beyond stocks and crypto to include futures, indices, forex, CFDs, commodities and other native-session markets. Added dedicated CME futures RTH OPEN handling, native-session OPEN support for indices/cash-market symbols, and improved OPEN[1] transition behavior. US-equity session logic has been hardened across premarket, RTH and after-hours, including a corrected CCL (current close) that stays hidden during RTH (regular trading hours) and uses the confirmed regular-session Daily close after the market closes. Daily high/low tracking now preserves full-session extended-hours behavior for equities while native-session assets maintain their own Daily history. Lower-timeframe levels are automatically suppressed when the chart timeframe cannot legitimately reconstruct them. Line/source anchoring, Daily/Weekly/Monthly history, right-side label controls and Pine v6 state handling have also been cleaned up and hardened. Label price, $ difference and % difference rows can now be controlled globally, while individual line and label families remain independently configurable.
Информация о релизе
This update focuses on making Candle Levels cleaner, more consistent, and easier to read when multiple reference levels are enabled.-Added a new dynamic right-label padding system with Grouped and Individual modes. Grouped mode is now the default and places related levels such as HOD/LOD or a timeframe’s Hi/Lo/Close at the same horizontal position. Individual mode gives every visible level its own position.
-Label spacing is user-adjustable, and enabled levels automatically maintain a fixed chronological hierarchy regardless of the order in which they are turned on.
-Updated previous-candle naming to a consistent P-prefix (previous) convention, such as P10m, P1D, P2D, P1W, P2W, P1M, etc. Hi/Lo/Close identifiers are displayed on a separate aligned row for improved readability.
-Added independent Default / Custom color controls for PCL, CCL, HOD/LOD, OPEN, PMO, Lower Timeframe, Daily, Weekly, and Monthly level families. Plot lines and their corresponding right-side labels now always use the same color.
The underlying asset/session-aware level calculations remain intact; this update primarily improves visual organization, naming consistency, and customization.
Скрипт с открытым кодом
В истинном духе TradingView, создатель этого скрипта сделал его открытым исходным кодом, чтобы трейдеры могли проверить и убедиться в его функциональности. Браво автору! Вы можете использовать его бесплатно, но помните, что перепубликация кода подчиняется нашим Правилам поведения.

🆓 Free scripts:
⚡ Pro scripts: tradingview.com/script/hESCvPuH-Predictive-Volume-MTF-Pro/
🙋♂️ Get help with Pinescript: simplecrypto.life/get-help-with-pinescript
⚡ Pro scripts: tradingview.com/script/hESCvPuH-Predictive-Volume-MTF-Pro/
🙋♂️ Get help with Pinescript: simplecrypto.life/get-help-with-pinescript
Отказ от ответственности
Информация и публикации не предназначены для предоставления и не являются финансовыми, инвестиционными, торговыми или другими видами советов или рекомендаций, предоставленных или одобренных TradingView. Подробнее читайте в Условиях использования.
Скрипт с открытым кодом
В истинном духе TradingView, создатель этого скрипта сделал его открытым исходным кодом, чтобы трейдеры могли проверить и убедиться в его функциональности. Браво автору! Вы можете использовать его бесплатно, но помните, что перепубликация кода подчиняется нашим Правилам поведения.
🆓 Free scripts:
⚡ Pro scripts: tradingview.com/script/hESCvPuH-Predictive-Volume-MTF-Pro/
🙋♂️ Get help with Pinescript: simplecrypto.life/get-help-with-pinescript
⚡ Pro scripts: tradingview.com/script/hESCvPuH-Predictive-Volume-MTF-Pro/
🙋♂️ Get help with Pinescript: simplecrypto.life/get-help-with-pinescript
Отказ от ответственности
Информация и публикации не предназначены для предоставления и не являются финансовыми, инвестиционными, торговыми или другими видами советов или рекомендаций, предоставленных или одобренных TradingView. Подробнее читайте в Условиях использования.