OPEN-SOURCE SCRIPT
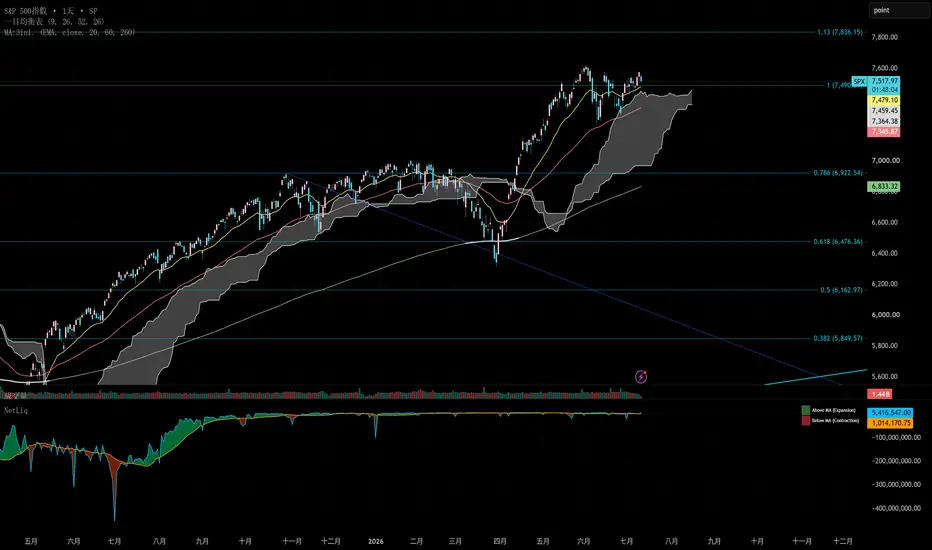
Fed Net Liquidity
中文說明
聯準會淨流動性指標(Fed Net Liquidity)
本指標追蹤美國金融體系中「可流通資金」的多寡,用以觀察總體資金環境對風險資產(如美股)的支撐或壓力。
計算方式
淨流動性 = 聯準會總資產(WALCL)− 隔夜逆回購餘額(RRPONTSYD)− 財政部一般帳戶餘額(WTREGEN),三者皆取自 FRED(聖路易斯聯邦準備銀行)。邏輯是:聯準會擴表會注入資金,但若這些資金被停在逆回購工具或財政部帳戶裡未流通,就不算真正進入市場的「有效流動性」,因此需要扣除這兩項。
如何使用
淨流動性線位於20週均線之上(綠色區塊):資金環境偏寬鬆,對股市傾向有利。
淨流動性線位於20週均線之下(紅色區塊):資金正被抽離,對股市傾向不利。
建議關注轉折點(由紅翻綠或反之),而非絕對數值高低,轉折對市場情緒的參考意義通常大於水位本身。
本指標更新頻率為週,不適合作為短線進出場訊號,較適合用於中長期總體資金環境的背景判斷,需搭配其他技術面或基本面分析綜合使用。
注意事項
數據更新頻率有落差(WALCL、TGA為週資料,RRP為日資料),圖表顯示上會呈現階梯狀變化。本指標為簡化模型,未納入全球其他央行資金流動、企業獲利、利率政策等其他重要變數,僅供教育與研究參考,不構成投資建議。
English Description
Fed Net Liquidity Indicator
This indicator tracks the amount of freely circulating liquidity in the U.S. financial system, used to gauge whether the macro funding environment is supportive of or a headwind for risk assets such as U.S. equities.
Methodology
Net Liquidity = Fed Total Assets (WALCL) − Overnight Reverse Repo balance (RRPONTSYD) − Treasury General Account balance (WTREGEN), all sourced from FRED (Federal Reserve Bank of St. Louis). The logic: Fed balance sheet expansion injects liquidity, but funds parked in the reverse repo facility or the Treasury's account aren't actually circulating in markets, so both are subtracted to isolate "usable" liquidity.
How to use it
Net Liquidity line above its 20-week MA (green zone): liquidity conditions are loosening, generally supportive for equities.
Net Liquidity line below its 20-week MA (red zone): liquidity is being drained, generally a headwind for equities.
Focus on inflection points (line crossing from red to green or vice versa) rather than absolute levels — the direction change tends to carry more signal value than the level itself.
Data updates weekly, so this is not suited for short-term entry/exit timing. It works best as a macro backdrop indicator for medium- to long-term positioning, combined with other technical or fundamental analysis.
Notes
Update frequencies differ across components (WALCL and TGA are weekly; RRP is daily), which produces a stair-step pattern on the chart. This is a simplified model that does not account for other major variables such as global central bank liquidity, corporate earnings, or interest rate policy. For educational and research purposes only; not investment advice.
聯準會淨流動性指標(Fed Net Liquidity)
本指標追蹤美國金融體系中「可流通資金」的多寡,用以觀察總體資金環境對風險資產(如美股)的支撐或壓力。
計算方式
淨流動性 = 聯準會總資產(WALCL)− 隔夜逆回購餘額(RRPONTSYD)− 財政部一般帳戶餘額(WTREGEN),三者皆取自 FRED(聖路易斯聯邦準備銀行)。邏輯是:聯準會擴表會注入資金,但若這些資金被停在逆回購工具或財政部帳戶裡未流通,就不算真正進入市場的「有效流動性」,因此需要扣除這兩項。
如何使用
淨流動性線位於20週均線之上(綠色區塊):資金環境偏寬鬆,對股市傾向有利。
淨流動性線位於20週均線之下(紅色區塊):資金正被抽離,對股市傾向不利。
建議關注轉折點(由紅翻綠或反之),而非絕對數值高低,轉折對市場情緒的參考意義通常大於水位本身。
本指標更新頻率為週,不適合作為短線進出場訊號,較適合用於中長期總體資金環境的背景判斷,需搭配其他技術面或基本面分析綜合使用。
注意事項
數據更新頻率有落差(WALCL、TGA為週資料,RRP為日資料),圖表顯示上會呈現階梯狀變化。本指標為簡化模型,未納入全球其他央行資金流動、企業獲利、利率政策等其他重要變數,僅供教育與研究參考,不構成投資建議。
English Description
Fed Net Liquidity Indicator
This indicator tracks the amount of freely circulating liquidity in the U.S. financial system, used to gauge whether the macro funding environment is supportive of or a headwind for risk assets such as U.S. equities.
Methodology
Net Liquidity = Fed Total Assets (WALCL) − Overnight Reverse Repo balance (RRPONTSYD) − Treasury General Account balance (WTREGEN), all sourced from FRED (Federal Reserve Bank of St. Louis). The logic: Fed balance sheet expansion injects liquidity, but funds parked in the reverse repo facility or the Treasury's account aren't actually circulating in markets, so both are subtracted to isolate "usable" liquidity.
How to use it
Net Liquidity line above its 20-week MA (green zone): liquidity conditions are loosening, generally supportive for equities.
Net Liquidity line below its 20-week MA (red zone): liquidity is being drained, generally a headwind for equities.
Focus on inflection points (line crossing from red to green or vice versa) rather than absolute levels — the direction change tends to carry more signal value than the level itself.
Data updates weekly, so this is not suited for short-term entry/exit timing. It works best as a macro backdrop indicator for medium- to long-term positioning, combined with other technical or fundamental analysis.
Notes
Update frequencies differ across components (WALCL and TGA are weekly; RRP is daily), which produces a stair-step pattern on the chart. This is a simplified model that does not account for other major variables such as global central bank liquidity, corporate earnings, or interest rate policy. For educational and research purposes only; not investment advice.
Скрипт с открытым кодом
В истинном духе TradingView, создатель этого скрипта сделал его открытым исходным кодом, чтобы трейдеры могли проверить и убедиться в его функциональности. Браво автору! Вы можете использовать его бесплатно, но помните, что перепубликация кода подчиняется нашим Правилам поведения.

Отказ от ответственности
Информация и публикации не предназначены для предоставления и не являются финансовыми, инвестиционными, торговыми или другими видами советов или рекомендаций, предоставленных или одобренных TradingView. Подробнее читайте в Условиях использования.
Скрипт с открытым кодом
В истинном духе TradingView, создатель этого скрипта сделал его открытым исходным кодом, чтобы трейдеры могли проверить и убедиться в его функциональности. Браво автору! Вы можете использовать его бесплатно, но помните, что перепубликация кода подчиняется нашим Правилам поведения.
Отказ от ответственности
Информация и публикации не предназначены для предоставления и не являются финансовыми, инвестиционными, торговыми или другими видами советов или рекомендаций, предоставленных или одобренных TradingView. Подробнее читайте в Условиях использования.