Обновлено
Heikin Ashi Oscillator
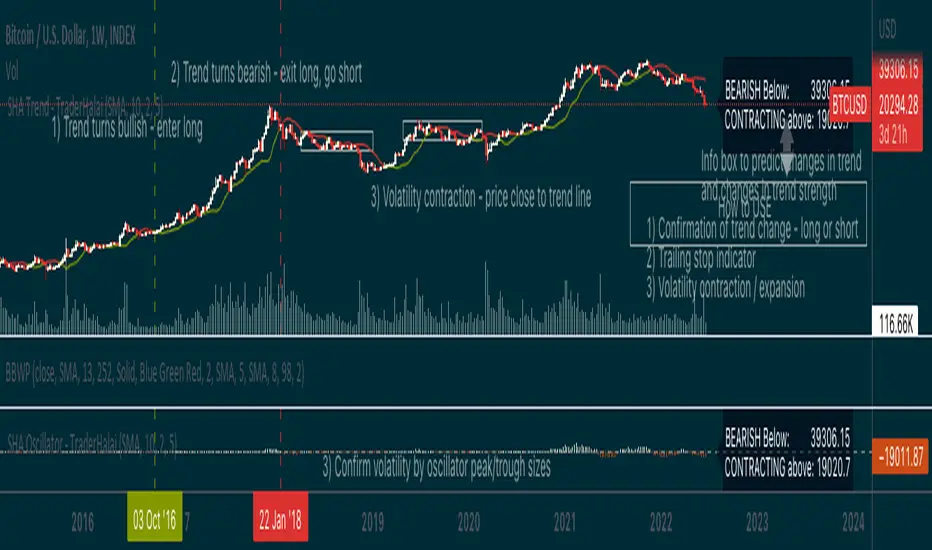
This indicator plots a delta between the Heiken Ashi close price and the regular candlestick closing price as a histogram, which allows you to quickly analyse changes in trend
direction.
It also provides a reverse-engineered closing price for regular candlesticks, to reach in order to maintain the momentum, which allows you to be forewarned of potential pivot points to change in bias in direction.
Feel free to use this indicator to modify and add to your charts as you wish.
direction.
It also provides a reverse-engineered closing price for regular candlesticks, to reach in order to maintain the momentum, which allows you to be forewarned of potential pivot points to change in bias in direction.
Feel free to use this indicator to modify and add to your charts as you wish.
Информация о релизе
Functions to avoid repaint if backtesting. Update to use columns instead of Histogram. Minor cleanupИнформация о релизе
New Feature: Update script to allow for smoothing function similar to the On-Chart script that has been created also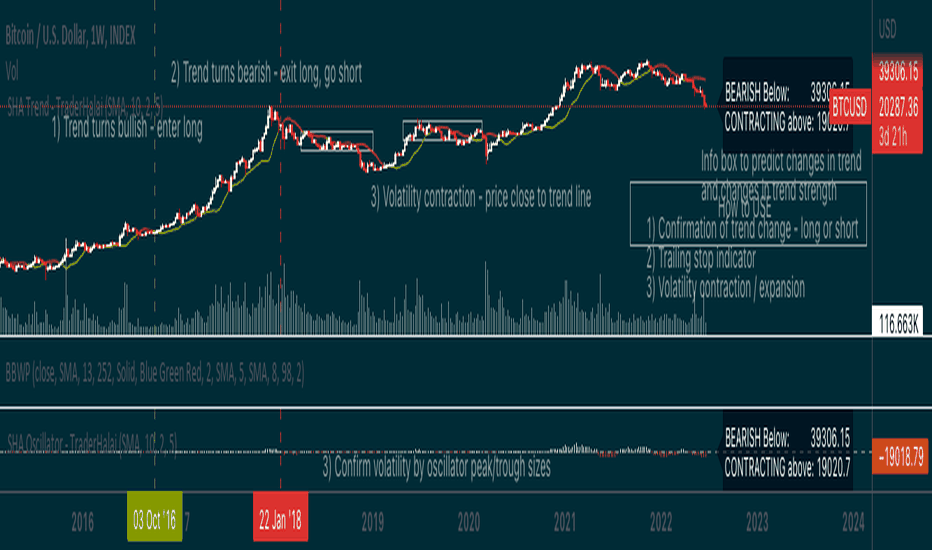
Информация о релизе
Added some spicy smoothing methods - Hull Moving Average, Volume Weighted Moving Average and RSI Moving AverageИнформация о релизе
Update info box text to include volatility to assess trend strengthИнформация о релизе
Add grow/fall colours similar to MACD to aid with visual assistance
Отказ от ответственности
Информация и публикации не предназначены для предоставления и не являются финансовыми, инвестиционными, торговыми или другими видами советов или рекомендаций, предоставленных или одобренных TradingView. Подробнее читайте в Условиях использования.
Отказ от ответственности
Информация и публикации не предназначены для предоставления и не являются финансовыми, инвестиционными, торговыми или другими видами советов или рекомендаций, предоставленных или одобренных TradingView. Подробнее читайте в Условиях использования.