OPEN-SOURCE SCRIPT
Обновлено LiqLines Pro: Auto & Manual Percentage Grid
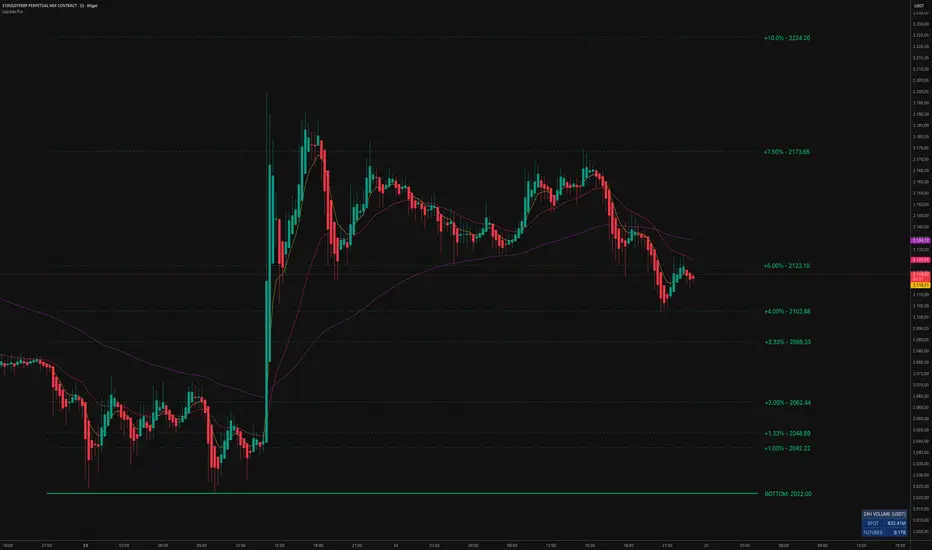
Description:
The LiqLines Pro indicator is a pure structural mapping tool designed to plot dynamic, percentage-based reference levels for any chosen asset. It allows traders to visualize exact mathematical distances from specific top and bottom coordinates, either automatically or via manual selection.
Core Mechanics and Calculation Engine:
1. Auto-Detection vs. Manual Level Selection
Auto-Detection (Default): By default, the script utilizes the ta.highest() and ta.lowest() functions over a user-defined lookback period (default 500 bars). It identifies the macro structural extremes within this window and projects the percentage grid based on those prices.
Manual Level Selection (Anchoring): The core feature of this tool is its integration of Pine Script's input.price() functionality. Users can override the auto-detection engine to set custom origin points. By selecting the indicator's "Settings" or "Reset Inputs", users can use their mouse to click directly on the chart, manually selecting the top or bottom level at any specific wick, breakout candle, or structural gap. Furthermore, users can freely adjust these levels by simply dragging and dropping the anchor lines up or down to new areas on the chart. The entire grid instantly recalculates based on this newly selected price. The script also includes a parity-check safety measure; if the asset is changed and the selected level falls completely out of bounds, it defaults back to auto-detection seamlessly.
2. Modular Percentage Tiers & Customization
Instead of relying on standard fixed ticks, the script calculates strict percentage deviations (e.g., +1.00%, +5.00%, -10.00%) from the active top and bottom levels. To maintain a clean chart interface, users have full control to toggle individual percentage lines on or off for both upward and downward directions. This allows traders to fully customize their grid, showing only the specific percentage levels they need for their strategy. By default, only the micro-levels (1% to 10%) are enabled .
3. Dynamic Proximity Alerts
The script includes a built-in mathematical proximity detector. It continuously calculates the absolute distance between the current close price and the plotted percentage lines. If the price enters a proximity threshold (strictly defined as a 0.1% distance from the level), the specific line and its corresponding label dynamically change color to Yellow. This provides visual feedback when price interacts with a specific percentage deviation zone.
Map your own structural levels and define your own trading zones…
Информация о релизе
LiqLines Pro V.2.6 is a precision structural mapping tool designed to identify liquidity clusters and percentage-based retracement zones.Core Mechanics:
• Dual-Mode Anchoring: The script automatically detects extreme Highs/Lows. Want full control? Switch to Manual Mode by simply clicking your desired anchor points on the chart.
• Micro & Macro Grids: Grouped toggles allow you to seamlessly switch between Micro (1%-10%) and Macro (>10%) percentage levels.
What's New in V.2.6:
• Smart Reset & Parity Lock: Automatically detects symbol changes to prevent scale mismatches. If your manual points get stuck on a previous asset, hit the "Force Reset to Auto" toggle in the settings for an instant clean slate.
• Zig-Zag Staggering: A smart layout algorithm that shifts alternating labels, completely preventing text overlap on tight price ranges.
• Anti-Flicker Engine: Rewritten drawing logic ensures smooth, lag-free performance during live price action.
• New Listing Support: Dynamic lookback execution prevents errors and ensures flawless operation on newly listed assets with limited bar history.
Информация о релизе
What's New in This Update?In this update, the indicator's core logic and visual interface have been significantly overhauled to provide more accurate volume tracking, better structural anchoring, and a cleaner chart layout. Below are the detailed technical improvements:
1. Expanded Level Tracking
Added new micro and macro proximity targets (7.50%, 15.0%, 25.0%, and 100.0%) to the existing structural matrix to expand the user's mapping capabilities.
2. UI & Label Anchoring Redesign
Completely redesigned the label anchoring system. Labels are now strictly right-aligned using a fixed pointer-box style to prevent alignment shifting when zooming or scrolling on the chart.
Minimalist UI Mode: Pointer boxes are set to transparent by default for a minimalist, floating-text look. Users can now toggle "Show Pointer Boxes" and customize the box background color via settings.
Dynamic Color Sync: Level text colors now dynamically synchronize with their respective anchor zones (Top levels default to Red, Bottom levels default to Green). This is completely customizable.
Line Styles: Added a dedicated dropdown to customize the inner percentage line styles (Solid, Dashed, Dotted) to reduce chart clutter.
3. 3-EMA Trend Filter Integration
Integrated an independent 3-EMA Setup (7, 25, 99) to allow users to filter the directional trend before interacting with the plotted structural zones.
4. NEW MODULE: 24H Rolling Volume Matrix HUD
Added a completely new, dedicated volume panel to provide contextual depth to the plotted structural liquidity levels.
Contextual Purpose: Price action alone at liquidity zones can be deceptive. By comparing Spot (genuine buying/selling) against Futures (leveraged volume) side-by-side, this module helps users differentiate between true structural breakouts and temporary liquidation sweeps (leverage hunting fakeouts).
Technical Execution: Driven by a highly accurate 24H Rolling Volume Engine. It calculates a cumulative rolling sum (Quote Volume in USDT) over the last 24 hours based on the active intraday timeframe, rather than standard daily bars. Automatically falls back to "N/A" on non-supported tickers to prevent execution errors.
Data Source Note: The Volume Matrix explicitly routes its data feeds to Binance (Spot & Futures) regardless of the active chart's exchange. This is a deliberate design choice to analyze the market's highest liquidity baseline and prevent fragmented volume tracking.
Скрипт с открытым кодом
В истинном духе TradingView, создатель этого скрипта сделал его открытым исходным кодом, чтобы трейдеры могли проверить и убедиться в его функциональности. Браво автору! Вы можете использовать его бесплатно, но помните, что перепубликация кода подчиняется нашим Правилам поведения.

Отказ от ответственности
Информация и публикации не предназначены для предоставления и не являются финансовыми, инвестиционными, торговыми или другими видами советов или рекомендаций, предоставленных или одобренных TradingView. Подробнее читайте в Условиях использования.
Скрипт с открытым кодом
В истинном духе TradingView, создатель этого скрипта сделал его открытым исходным кодом, чтобы трейдеры могли проверить и убедиться в его функциональности. Браво автору! Вы можете использовать его бесплатно, но помните, что перепубликация кода подчиняется нашим Правилам поведения.
Отказ от ответственности
Информация и публикации не предназначены для предоставления и не являются финансовыми, инвестиционными, торговыми или другими видами советов или рекомендаций, предоставленных или одобренных TradingView. Подробнее читайте в Условиях использования.