Обновлено
Domain Expansion - London Range, Overnight ATR & CBDR Qualifier
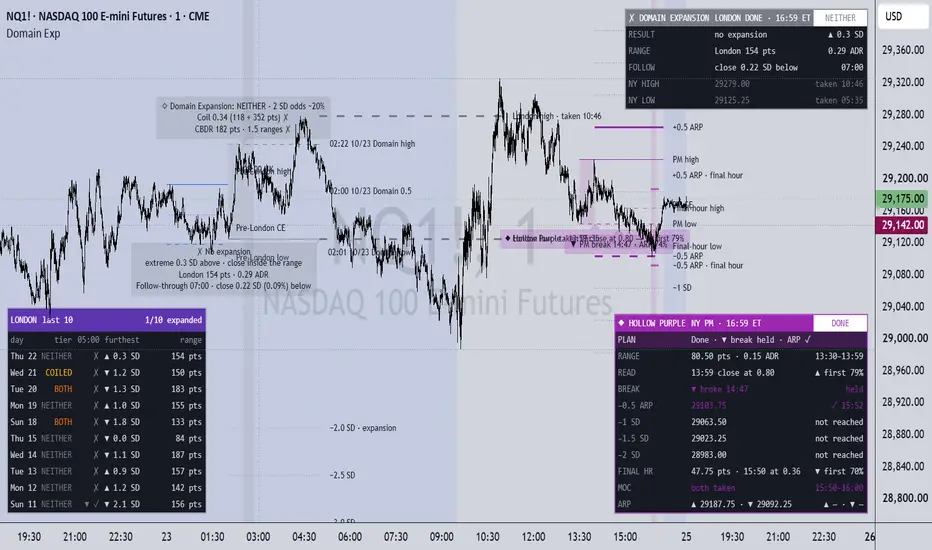
Domain Expansion
London opens, and in its first 30 minutes a range forms. On the right days, one side of that range gives way and price runs. Domain Expansion maps that range. It checks at 02:30 whether the day has the conditions for an expansion, and measures how far the move travels in multiples of the range. It’s the last of my models that isn’t tied to the economic calendar.
In Jujutsu Kaisen, a Domain Expansion pulls the whole battlefield onto its user’s terms. A real London expansion does the same. Most sessions trade both ways and go nowhere, but when one breaks out, the move is decisive.
This is a confluence map, not a signal. Use it next to your own model. It’s open source, so take it, test it, break it and build on it.
How it works (times in ET)
14:00 → 20:00: the CBDR (Central Bank Dealers Range) forms, from the prior afternoon into the evening.
18:00 → 02:29: the overnight session runs and feeds the overnight ATR (average of the last 5 overnights).
02:00 → 02:30: the domain range forms.
02:30: the qualifier label prints: BOTH, one factor, or NEITHER.
02:30 → 02:50: the execution window, shaded in the tier colour, with the first break of the range marked.
03:00 (08:00 UK): the London and Frankfurt cash open is marked.
05:00: end of London, and the result label prints.
07:00: the follow-through label prints.
The qualifier: two factors, four colours
Both factors are checked at 02:30.
Factor 1 depends on how you measure an expansion:
Coiled (SD measure): the domain range divided by the overnight ATR is 0.20 or less. This is a tight range sitting against recent overnight volatility.
Volatile (% measure): the overnight ATR is 1.00% of price or more.
Factor 2 is a wide CBDR: the 14:00–20:00 ET range is at least 5 domain ranges (SD measure) or 0.80% of price (% measure).
The four tiers:
◆◆ BOTH: orange
◆ Coiled / volatile only: amber
◆ CBDR only: cyan
◇ NEITHER: grey
The 02:30 label shows:
The tier.
Each factor’s reading with a ✓ or ✗.
The tier’s historical odds, when you’re using the default measure.
The tier colour carries through the day:
The execution window shading.
The break markers.
The result label on expansion days.
What counts as an expansion
You choose the measure:
SD at the London extreme (default): the furthest point price reaches past the range between 02:30 and 04:59, with 2 SD needed.
SD at the 04:59 close.
% at the 04:59 close, with 0.30% needed.
The expansion threshold is drawn on both sides of the range. If an SD level already sits on it, that level is tagged “· expansion”.
What you see
The domain range
The box: shaded from 02:00 to 02:30.
High and low: each labelled with the time it formed.
Midpoint: the 0.5 of the range.
Standard deviations (multiples of the domain range)
Placement: each level sits beyond the high (+) and the low (−).
Presets: 2.0, 2.5, 3.0 and 4.0 are on; 1.0, 1.5 and 5.0 are optional.
Custom SDs: type your own multiples, e.g. 3.5, 6. Up to 10, with their own colour and line style.
When to draw: always, on BOTH days only, or on any day with at least one factor.
Execution and result
Execution window: shaded 02:30–02:50, with “▲ Break 02:34” or “▼ Break 02:41” when the range first gives way.
08:00 UK open line: 03:00 ET most of the year, 04:00 ET in the weeks when US and UK clocks are out of step.
Result at 05:00:
“✓ Domain Expansion ▲”, “✓ Domain Expansion ▼” or “✗ No expansion”.
The London extreme in SD, and the close in SD and %.
Follow-through at 07:00: where price closed relative to the range after London.
Drawing
One day at a time: every level starts at 02:00 and stops at 05:00. Nothing carries into the next session.
Status: levels turn dashed once traded through and go grey after 5 trading days.
Settings
Sessions (ET)
Domain range (02:00–02:30)
Execution window (02:30–02:50)
Domain to end of London (02:00–05:00)
Overnight for the ATR (18:00–02:30)
Follow-through window (05:00–07:00)
Qualifier
Overnight ATR:
Overnights in the average (5).
True range, including the gap from the 16:59 close (on).
Thresholds:
Coiled: range ÷ ATR (0.20).
Volatile: ATR as % of price (1.00%).
CBDR:
Session (14:00–20:00).
Wide for the SD measure (5 domain ranges).
Wide for the % measure (0.80%).
Colours: one for each tier (Both, Coiled / volatile only, CBDR only, Neither).
What counts as an expansion
Measure: SD at the London extreme, SD at the 04:59 close, or % at the 04:59 close
SD needed (2.0)
% needed (0.30)
Expansion line on/off, with colour
Domain range
High / low colour
Midpoint
Range shading
Standard deviations
When to draw: always, both factors only, or at least one factor
Presets 1.0–5.0
SD colour
Custom SDs, with their own colour and line style
Execution & result
Execution window shading
First break marker
Result at the end of London
Follow-through label
08:00 UK open line
Drawing
Days to keep (10)
Label date format (HH:mm MM/dd)
Text colour and size
Fresh-for-N-days (5), then the aged colour
Use it on an intraday chart of 15 minutes or less, with 1 minute recommended. The overnight ATR and the CBDR are read from 15-minute data, so the qualifier works from the first day on your chart.
The CBDR and projecting a range in standard deviations come from the teaching of Michael J. Huddleston, the Inner Circle Trader.
The range always comes before the expansion. Be patient while it forms, stay disciplined while it breaks, and back yourself when the time comes.
— Unclehk2000
London opens, and in its first 30 minutes a range forms. On the right days, one side of that range gives way and price runs. Domain Expansion maps that range. It checks at 02:30 whether the day has the conditions for an expansion, and measures how far the move travels in multiples of the range. It’s the last of my models that isn’t tied to the economic calendar.
In Jujutsu Kaisen, a Domain Expansion pulls the whole battlefield onto its user’s terms. A real London expansion does the same. Most sessions trade both ways and go nowhere, but when one breaks out, the move is decisive.
This is a confluence map, not a signal. Use it next to your own model. It’s open source, so take it, test it, break it and build on it.
How it works (times in ET)
14:00 → 20:00: the CBDR (Central Bank Dealers Range) forms, from the prior afternoon into the evening.
18:00 → 02:29: the overnight session runs and feeds the overnight ATR (average of the last 5 overnights).
02:00 → 02:30: the domain range forms.
02:30: the qualifier label prints: BOTH, one factor, or NEITHER.
02:30 → 02:50: the execution window, shaded in the tier colour, with the first break of the range marked.
03:00 (08:00 UK): the London and Frankfurt cash open is marked.
05:00: end of London, and the result label prints.
07:00: the follow-through label prints.
The qualifier: two factors, four colours
Both factors are checked at 02:30.
Factor 1 depends on how you measure an expansion:
Coiled (SD measure): the domain range divided by the overnight ATR is 0.20 or less. This is a tight range sitting against recent overnight volatility.
Volatile (% measure): the overnight ATR is 1.00% of price or more.
Factor 2 is a wide CBDR: the 14:00–20:00 ET range is at least 5 domain ranges (SD measure) or 0.80% of price (% measure).
The four tiers:
◆◆ BOTH: orange
◆ Coiled / volatile only: amber
◆ CBDR only: cyan
◇ NEITHER: grey
The 02:30 label shows:
The tier.
Each factor’s reading with a ✓ or ✗.
The tier’s historical odds, when you’re using the default measure.
The tier colour carries through the day:
The execution window shading.
The break markers.
The result label on expansion days.
What counts as an expansion
You choose the measure:
SD at the London extreme (default): the furthest point price reaches past the range between 02:30 and 04:59, with 2 SD needed.
SD at the 04:59 close.
% at the 04:59 close, with 0.30% needed.
The expansion threshold is drawn on both sides of the range. If an SD level already sits on it, that level is tagged “· expansion”.
What you see
The domain range
The box: shaded from 02:00 to 02:30.
High and low: each labelled with the time it formed.
Midpoint: the 0.5 of the range.
Standard deviations (multiples of the domain range)
Placement: each level sits beyond the high (+) and the low (−).
Presets: 2.0, 2.5, 3.0 and 4.0 are on; 1.0, 1.5 and 5.0 are optional.
Custom SDs: type your own multiples, e.g. 3.5, 6. Up to 10, with their own colour and line style.
When to draw: always, on BOTH days only, or on any day with at least one factor.
Execution and result
Execution window: shaded 02:30–02:50, with “▲ Break 02:34” or “▼ Break 02:41” when the range first gives way.
08:00 UK open line: 03:00 ET most of the year, 04:00 ET in the weeks when US and UK clocks are out of step.
Result at 05:00:
“✓ Domain Expansion ▲”, “✓ Domain Expansion ▼” or “✗ No expansion”.
The London extreme in SD, and the close in SD and %.
Follow-through at 07:00: where price closed relative to the range after London.
Drawing
One day at a time: every level starts at 02:00 and stops at 05:00. Nothing carries into the next session.
Status: levels turn dashed once traded through and go grey after 5 trading days.
Settings
Sessions (ET)
Domain range (02:00–02:30)
Execution window (02:30–02:50)
Domain to end of London (02:00–05:00)
Overnight for the ATR (18:00–02:30)
Follow-through window (05:00–07:00)
Qualifier
Overnight ATR:
Overnights in the average (5).
True range, including the gap from the 16:59 close (on).
Thresholds:
Coiled: range ÷ ATR (0.20).
Volatile: ATR as % of price (1.00%).
CBDR:
Session (14:00–20:00).
Wide for the SD measure (5 domain ranges).
Wide for the % measure (0.80%).
Colours: one for each tier (Both, Coiled / volatile only, CBDR only, Neither).
What counts as an expansion
Measure: SD at the London extreme, SD at the 04:59 close, or % at the 04:59 close
SD needed (2.0)
% needed (0.30)
Expansion line on/off, with colour
Domain range
High / low colour
Midpoint
Range shading
Standard deviations
When to draw: always, both factors only, or at least one factor
Presets 1.0–5.0
SD colour
Custom SDs, with their own colour and line style
Execution & result
Execution window shading
First break marker
Result at the end of London
Follow-through label
08:00 UK open line
Drawing
Days to keep (10)
Label date format (HH:mm MM/dd)
Text colour and size
Fresh-for-N-days (5), then the aged colour
Use it on an intraday chart of 15 minutes or less, with 1 minute recommended. The overnight ATR and the CBDR are read from 15-minute data, so the qualifier works from the first day on your chart.
The CBDR and projecting a range in standard deviations come from the teaching of Michael J. Huddleston, the Inner Circle Trader.
The range always comes before the expansion. Be patient while it forms, stay disciplined while it breaks, and back yourself when the time comes.
— Unclehk2000
Информация о релизе
• Settings:– the Drawing section is now View, at the top: Theme, Text size, Text colour, label date format, days to keep and how older days fade;
– section names are plain, as in the newer indicators.
• Theme: Auto follows the chart background. Text, and every colour that used to default to black, now reads on dark charts as well as light:
Информация о релизе
i updated the chart by accident and looked horrificИнформация о релизе
London card, 02:00 to 17:00 ET. Live from 02:30 it shows:– the domain range and today's tier;
– the expected London range (02:00–04:59), its middle half, and how much of it is done;
– the furthest SD past the range so far;
– the live odds of 2 SD by 04:59;
– how often the London high and low were already in at this time, given price's distance from them.
After 05:00 it shows the result, the London range against ADR20, the follow-through close (07:00), and whether New York has taken the London high and low.
• London high / low carried to 11:00 ET and marked when taken, or "not taken by 11:00". NY AM took the London high on 66% of sessions and the low on 62%; by 11:00, 75% and 71%.
• Recent London sessions: a table of the last 10 (3–30): tier, result at 05:00, furthest SD and range.
• Pre-London dealing range: the high, low and CE of 00:00–00:59 ET, drawn to 02:00 (London open) or, by setting, to 05:00. London took its high on 78% of sessions and its low on 73%; at least one 99.7%, both 52%. London traded through the CE on 75% of sessions, and on 64% when price sat outside the range at 02:00.
• Alerts (one alert on "Any alert() function call"): domain range set with the tier, first break in the execution window, expansion line reached, the 05:00 result, and the London high or low taken before 11:00. Each can be switched off.
• Removed: overnight equal highs / lows and the peak-volume level (not part of the model).
• Cleaner chart:
– two text notes a day, on every timeframe: the tier at 02:30, and the 05:00 result with the follow-through (07:00) added to it;
– the first break is labelled at its candle, e.g. "▲ Break 02:33";
– the notes keep off each other: the tier note moves to the side away from the first break (beyond the pre-London range when its labels sit at 02:00), and the 05:00 note goes on the other side, beyond the London high or low and to the left of 05:00, clear of London's candles and the 05:00 line labels;
– labels that meet at the same time keep their text off each other's lines: at 05:00 the domain, SD and pre-London labels against each other and against the London high / low (e.g. when the London low is the domain low); at 02:00 the pre-London labels against the domain lines.
• Colours:
– "Card theme" sets the cards, and their text always follows it;
– "Chart text colour" only colours the labels on the chart, and at its default follows the chart background. A dark card on a light chart with black chart text now reads properly;
– card headers use dark text on light tier colours.
• Odds come from NQ + ES + RTY 1-minute 2018–26 (6,135 London sessions; 5,526 for the pre-London range), split by coiled days where it matters. They held steady in 2018–24 and 2025–26 and on each symbol, and are shown only at the default settings they were measured on. Expected range: fitted on 2018–24, checked on 2025–26 (48% inside the middle half, R² 0.87).
Информация о релизе
Hollow Purple: the NY PM model, added to Domain Expansion. The London model and card are unchanged.• The PM range (13:30–13:59) read at 14:00: where the 13:59 close sits gives the odds of which side breaks first (12% → 89% up, bottom to top octant).
• The −0.5 ARP (algorithmic range projection) and 1 / 1.5 / 2 SD to 16:14. On the first-break side by 16:14: 74 / 51 / 35 / 23%.
• The final-hour range (15:00–15:49) drawn as it forms and set at 15:50, with its −0.5 ARP, and the MOC macro (15:50–16:00) shaded.
• A Hollow Purple card with ✓ times and live odds by 16:14, and new alerts. Its top row, PLAN, says what to watch now: the next level, how far away it is and its odds.
• Layout: Mobile (View settings) folds both cards to their key rows for a phone and hides the recent-sessions table.
• New default places, so the tables no longer overlap: London card top right, Hollow Purple bottom right, recent sessions bottom left. Saved charts keep the places they had, so move them once if they overlap.
• NQ + ES + RTY 1-minute 2018–26, 6,333 sessions; each figure held in 2018–24 and 2025–26 and on each symbol.
HOLLOW PURPLE · NY PM
The New York afternoon, built from ICT's Price Action Chronicles on the market-on-close (MOC) macro and tested on 6,333 sessions of NQ, ES and RTY (2018–26). Use a chart of 5 minutes or less for the final hour.
What it draws
• The PM range (13:30–13:59), shaded, with its high, low and CE. The NY PM session opens with the 13:30 pre-market, and its first 30 minutes play the part 09:30–10:00 plays in the morning.
• The read at 14:00: where the 13:59 close sits in the range, with the odds of which side breaks first.
• The −0.5 ARP (algorithmic range projection: half the range beyond the high or low) and 1, 1.5 and 2 SD, both sides, 14:00 to 16:14.
• The first break after 14:00, labelled at its candle.
• The final-hour range (15:00–15:49), drawn as it forms and set at 15:50, then its −0.5 ARP above and below.
• The MOC macro (15:50–16:00), shaded.
Card (13:30 → 17:00): the top row, PLAN, says what to watch now: before the break, the side the 14:00 read favours and its edge; after it, the next level on that side not yet reached, its distance and its odds by 16:14; from 15:50, the final-hour side the MOC is likely to take, then its ARP; after 16:14, the day's summary. Below it: the PM range against ADR20, the 14:00 read, the break and whether it held, the ARP and SDs on the break side with ✓ or the live odds by 16:14, then the final-hour range with the odds of which side the MOC takes first, what the MOC took, and the final-hour ARPs.
Layout: Desktop shows every row. Mobile (View settings) keeps PLAN, READ, BREAK and MOC on the Hollow Purple card and the key rows on the London card, and hides the recent-sessions table. Default places: London card top right, Hollow Purple bottom right, recent sessions bottom left.
What the tests showed (each held in 2018–24 and 2025–26 and on each symbol)
• The 13:59 close sets which side breaks first. % up first by octant, bottom to top: 12 · 19 · 29 · 44 · 55 · 67 · 79 · 89. Broken by 16:14 on 99.5% of sessions; the first break held on 52%.
• On the first-break side by 16:14: −0.5 ARP 74%, 1 SD 51%, 1.5 SD 35%, 2 SD 23% (2025–26: 69 · 45 · 30 · 18).
• The MOC macro (15:50–15:59) took one side of the final-hour range on 72% of sessions (to 16:14: 80%), and the side nearer price first. It reached the final-hour −0.5 ARP on 16% (to 16:14: 27%).
• Live odds: from a level's distance in ATR15 (the 15-minute ATR at 13:30) and the time left. Fit on 2018–24, scored on 2025–26: Brier 0.116 → 0.092. In 2025–26 levels traded up to 8 points less often than predicted.
Tested and not found
• The −0.5 ARP is not a terminus: MOC runs stopped there no more often than at −0.375 or −0.625.
• MOC lows and highs did not land on the day's octant, 16th or quadrant more than on a shifted grid (they were reached 61 / 49 / 40% of the time when price sat inside them at 15:50).
• Long in the tooth: MOC direction was 50 / 50 against the day's trend.
• Smooth equal highs or lows were taken less often than the jagged side.
A map of the afternoon with honest odds, not a list of turning points.
Credits: ICT (Michael J. Huddleston), Price Action Chronicles: Market On Close Macro, and MOC Crushing The Buying & Selling Pressure Myth (Aug 2026). Written from scratch.

Отказ от ответственности
Информация и публикации не предназначены для предоставления и не являются финансовыми, инвестиционными, торговыми или другими видами советов или рекомендаций, предоставленных или одобренных TradingView. Подробнее читайте в Условиях использования.
Отказ от ответственности
Информация и публикации не предназначены для предоставления и не являются финансовыми, инвестиционными, торговыми или другими видами советов или рекомендаций, предоставленных или одобренных TradingView. Подробнее читайте в Условиях использования.