OPEN-SOURCE SCRIPT
Multi-Timeframe MA Cross
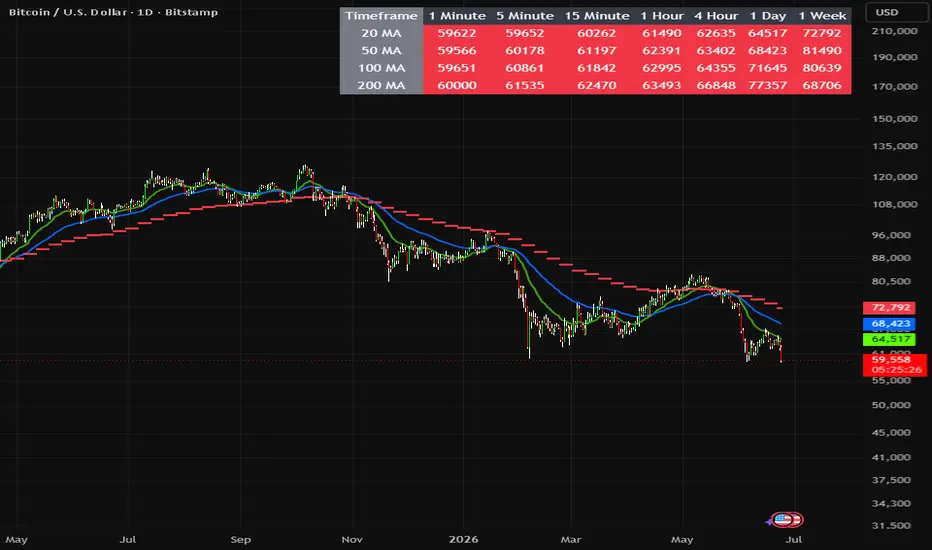
Multi-Timeframe MA Cross (MTFMAC) is a professional-grade trend analysis tool designed for traders who wish to view market structure across multiple timeframes at a glance. It consolidates key exponential moving averages (EMAs) into a single dashboard, helping traders make quick, informed decisions based on price alignment with moving averages.
This indicator provides a clear visual overview of trend direction and alignment from intraday (1-minute) to weekly charts. By highlighting whether price is above or below key EMAs and signalling EMA crossovers, traders can quickly identify bullish or bearish trends, trend strength, and high-probability trade setups.
Key Features
Multi-timeframe EMA dashboard (1 min → 1 week)
Real-time trend alignment for 20, 50, 100, and 200 EMAs
Visual "Above/Below" signals for each EMA
Weekly EMA overlays for higher timeframe context
Alerts for bullish/bearish alignment and EMA crosses
Fully customisable EMA lengths and visual settings
Professional table and chart display, overlaying price
How It Works
Compares the current price to 20, 50, 100, and 200 EMAs across multiple timeframes.
Colours indicate whether price is above (green) or below (red) the EMA.
Weekly EMA lines are plotted as dashed or circle-style overlays for macro trend context.
Alerts notify the trader when:
All EMAs align bullishly or bearishly
20 EMA crosses above or below 50 EMA
Best Use Cases
Trend-following strategies
Multi-timeframe confirmation
Swing and intraday trading
Spotting market bias and trend reversals
High-probability trade filtering
Alerts
Bullish Trend Alignment: All EMAs in ascending order, price above EMAs
Bearish Trend Alignment: All EMAs in descending order, price below EMAs
Bullish EMA Cross: 20 EMA crosses above 50 EMA
Bearish EMA Cross: 20 EMA crosses below 50 EMA
Notes and Disclaimers
This indicator does not repaint; all signals are based on confirmed bar data.
Use as a decision-support tool, not as sole trade advice. Combine with risk management.
Optimised for clear visualisation and multi-timeframe analysis.
This indicator provides a clear visual overview of trend direction and alignment from intraday (1-minute) to weekly charts. By highlighting whether price is above or below key EMAs and signalling EMA crossovers, traders can quickly identify bullish or bearish trends, trend strength, and high-probability trade setups.
Key Features
Multi-timeframe EMA dashboard (1 min → 1 week)
Real-time trend alignment for 20, 50, 100, and 200 EMAs
Visual "Above/Below" signals for each EMA
Weekly EMA overlays for higher timeframe context
Alerts for bullish/bearish alignment and EMA crosses
Fully customisable EMA lengths and visual settings
Professional table and chart display, overlaying price
How It Works
Compares the current price to 20, 50, 100, and 200 EMAs across multiple timeframes.
Colours indicate whether price is above (green) or below (red) the EMA.
Weekly EMA lines are plotted as dashed or circle-style overlays for macro trend context.
Alerts notify the trader when:
All EMAs align bullishly or bearishly
20 EMA crosses above or below 50 EMA
Best Use Cases
Trend-following strategies
Multi-timeframe confirmation
Swing and intraday trading
Spotting market bias and trend reversals
High-probability trade filtering
Alerts
Bullish Trend Alignment: All EMAs in ascending order, price above EMAs
Bearish Trend Alignment: All EMAs in descending order, price below EMAs
Bullish EMA Cross: 20 EMA crosses above 50 EMA
Bearish EMA Cross: 20 EMA crosses below 50 EMA
Notes and Disclaimers
This indicator does not repaint; all signals are based on confirmed bar data.
Use as a decision-support tool, not as sole trade advice. Combine with risk management.
Optimised for clear visualisation and multi-timeframe analysis.
Скрипт с открытым кодом
В истинном духе TradingView, создатель этого скрипта сделал его открытым исходным кодом, чтобы трейдеры могли проверить и убедиться в его функциональности. Браво автору! Вы можете использовать его бесплатно, но помните, что перепубликация кода подчиняется нашим Правилам поведения.

Отказ от ответственности
Информация и публикации не предназначены для предоставления и не являются финансовыми, инвестиционными, торговыми или другими видами советов или рекомендаций, предоставленных или одобренных TradingView. Подробнее читайте в Условиях использования.
Скрипт с открытым кодом
В истинном духе TradingView, создатель этого скрипта сделал его открытым исходным кодом, чтобы трейдеры могли проверить и убедиться в его функциональности. Браво автору! Вы можете использовать его бесплатно, но помните, что перепубликация кода подчиняется нашим Правилам поведения.
Отказ от ответственности
Информация и публикации не предназначены для предоставления и не являются финансовыми, инвестиционными, торговыми или другими видами советов или рекомендаций, предоставленных или одобренных TradingView. Подробнее читайте в Условиях использования.