EMA 20,50,200
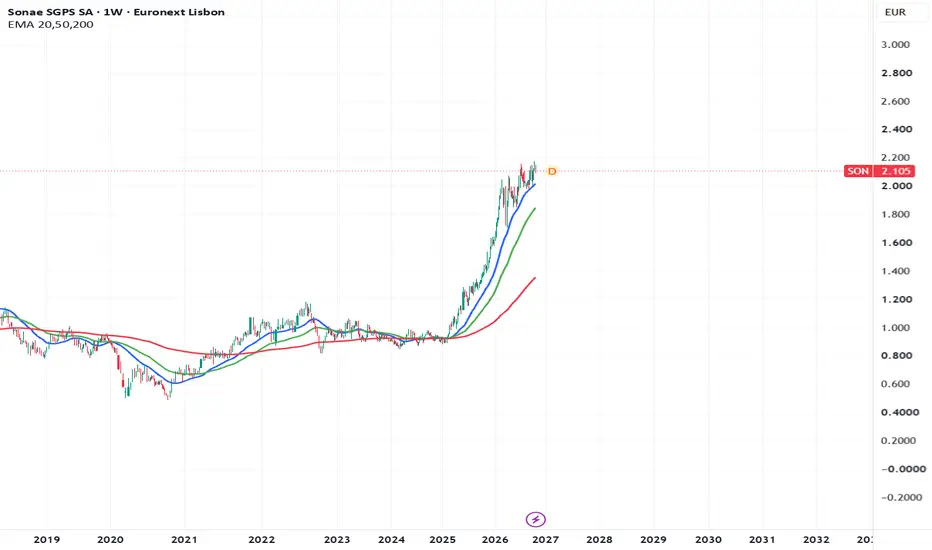
EMA 20,50,200
This indicator displays three customisable Exponential Moving Averages (EMAs) directly on your chart, helping you compare shorter, medium, and longer-term price trends.
Default settings
20-period EMA: Blue
50-period EMA: Green
200-period EMA: Red
Price source: Close
Additional smoothing: 9-period EMA applied to each EMA
Additional smoothing reduces fluctuations and produces smoother lines, while increasing lag compared with standard EMAs.
Customisation
In Settings → Inputs, you can change each EMA’s period and colour, show or hide individual lines, and select a different price source. Choose EMA, SMA, or None for smoothing, with an adjustable smoothing period. Select None to display standard EMAs without additional smoothing.
The chart title stays clean as EMA 20,50,200, with input selections hidden. The title remains fixed even when you change the periods.
Historical reference
This indicator acknowledges William Playfair (1759–1823), a pioneer of statistical graphics widely credited with introducing the statistical line graph, bar chart, and pie chart. His work helped establish the visual presentation of economic data that underpins modern financial charting.
Written in Pine Script v6. This is a visual trend indicator; it does not generate buy or sell signals or include alerts.
This indicator displays three customisable Exponential Moving Averages (EMAs) directly on your chart, helping you compare shorter, medium, and longer-term price trends.
Default settings
20-period EMA: Blue
50-period EMA: Green
200-period EMA: Red
Price source: Close
Additional smoothing: 9-period EMA applied to each EMA
Additional smoothing reduces fluctuations and produces smoother lines, while increasing lag compared with standard EMAs.
Customisation
In Settings → Inputs, you can change each EMA’s period and colour, show or hide individual lines, and select a different price source. Choose EMA, SMA, or None for smoothing, with an adjustable smoothing period. Select None to display standard EMAs without additional smoothing.
The chart title stays clean as EMA 20,50,200, with input selections hidden. The title remains fixed even when you change the periods.
Historical reference
This indicator acknowledges William Playfair (1759–1823), a pioneer of statistical graphics widely credited with introducing the statistical line graph, bar chart, and pie chart. His work helped establish the visual presentation of economic data that underpins modern financial charting.
Written in Pine Script v6. This is a visual trend indicator; it does not generate buy or sell signals or include alerts.

Отказ от ответственности
Информация и публикации не предназначены для предоставления и не являются финансовыми, инвестиционными, торговыми или другими видами советов или рекомендаций, предоставленных или одобренных TradingView. Подробнее читайте в Условиях использования.
Отказ от ответственности
Информация и публикации не предназначены для предоставления и не являются финансовыми, инвестиционными, торговыми или другими видами советов или рекомендаций, предоставленных или одобренных TradingView. Подробнее читайте в Условиях использования.